Active attacks occur for a variety of reasons, sometimes they are planned and other times not. Here, we show the timing of active attacks from 2000 to 2024, a critical element for premeditated attacks with the goal of maximizing casualties. As the plots demonstrate, some dimensions of time are more informative than others.
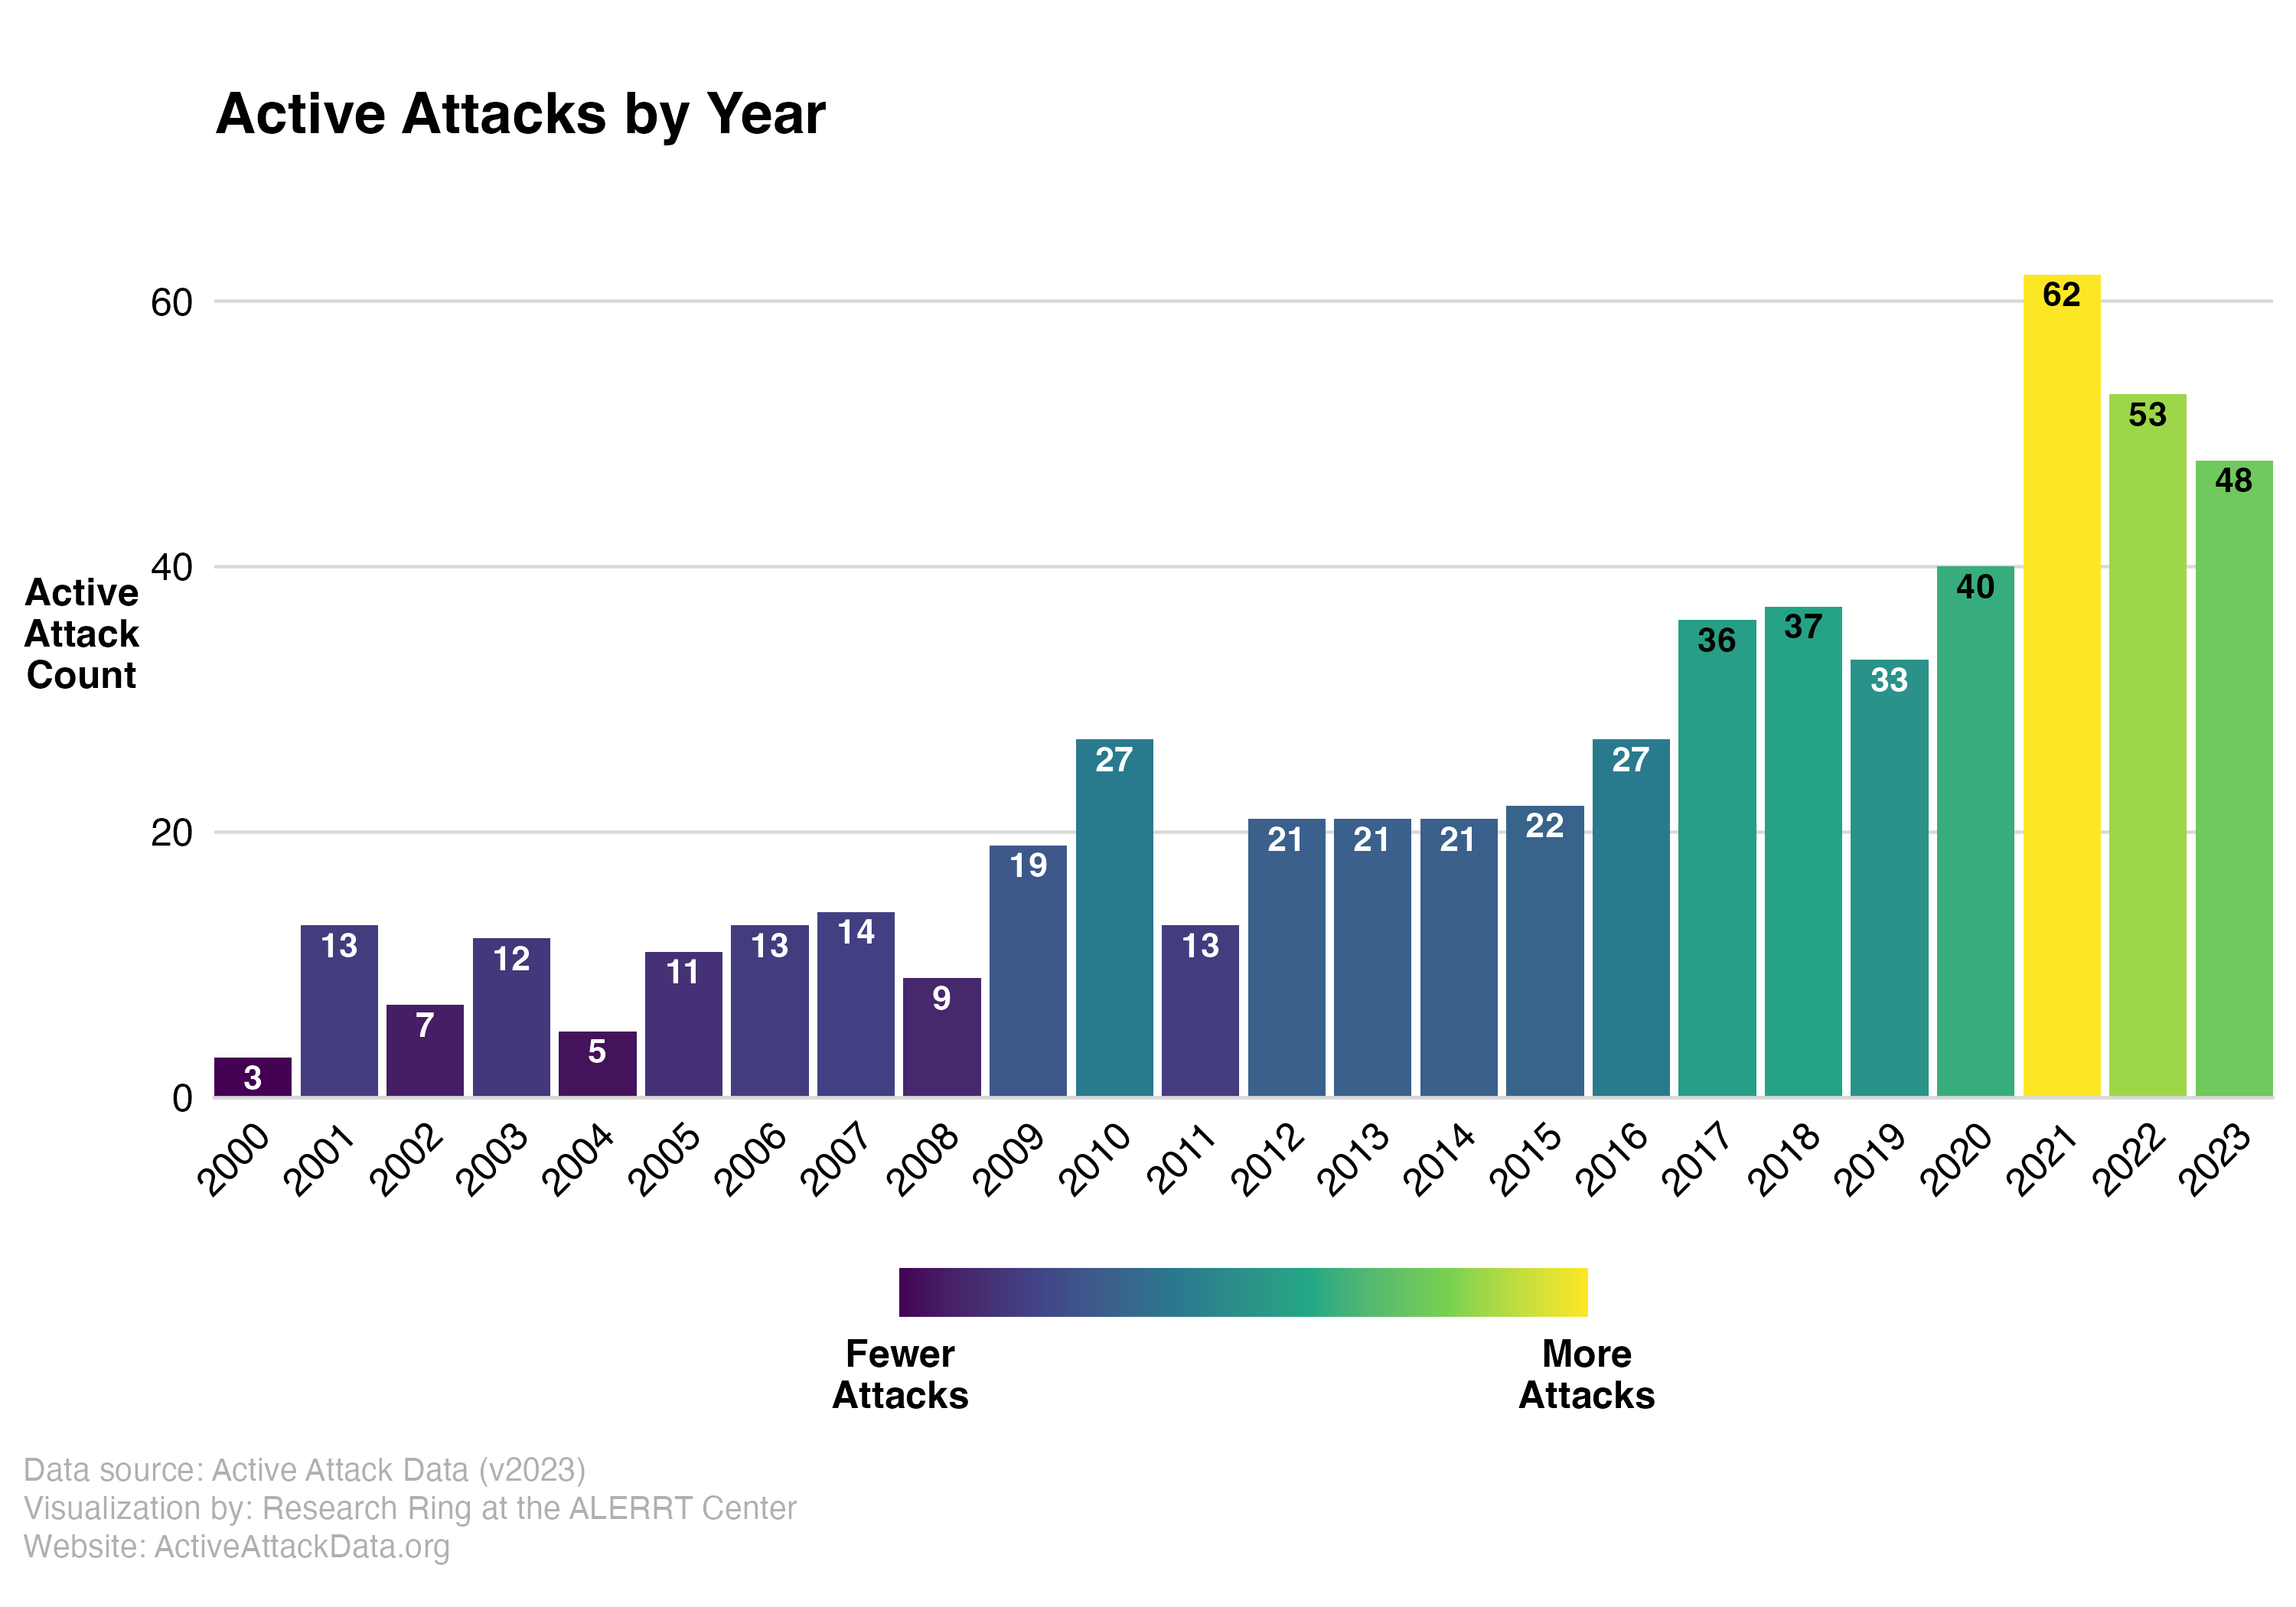
By Year
There appears to be more events in the last five years (mean = 44) than the first five years (mean = 8) or second five years (mean = 16); however, this may be an artifact of media coverage. Attacks that occurred during the first part of this data collection period likely did not get the national coverage that they do now. Furthermore, technology and search engines have improved dramatically over the 25 years of this data collection period.
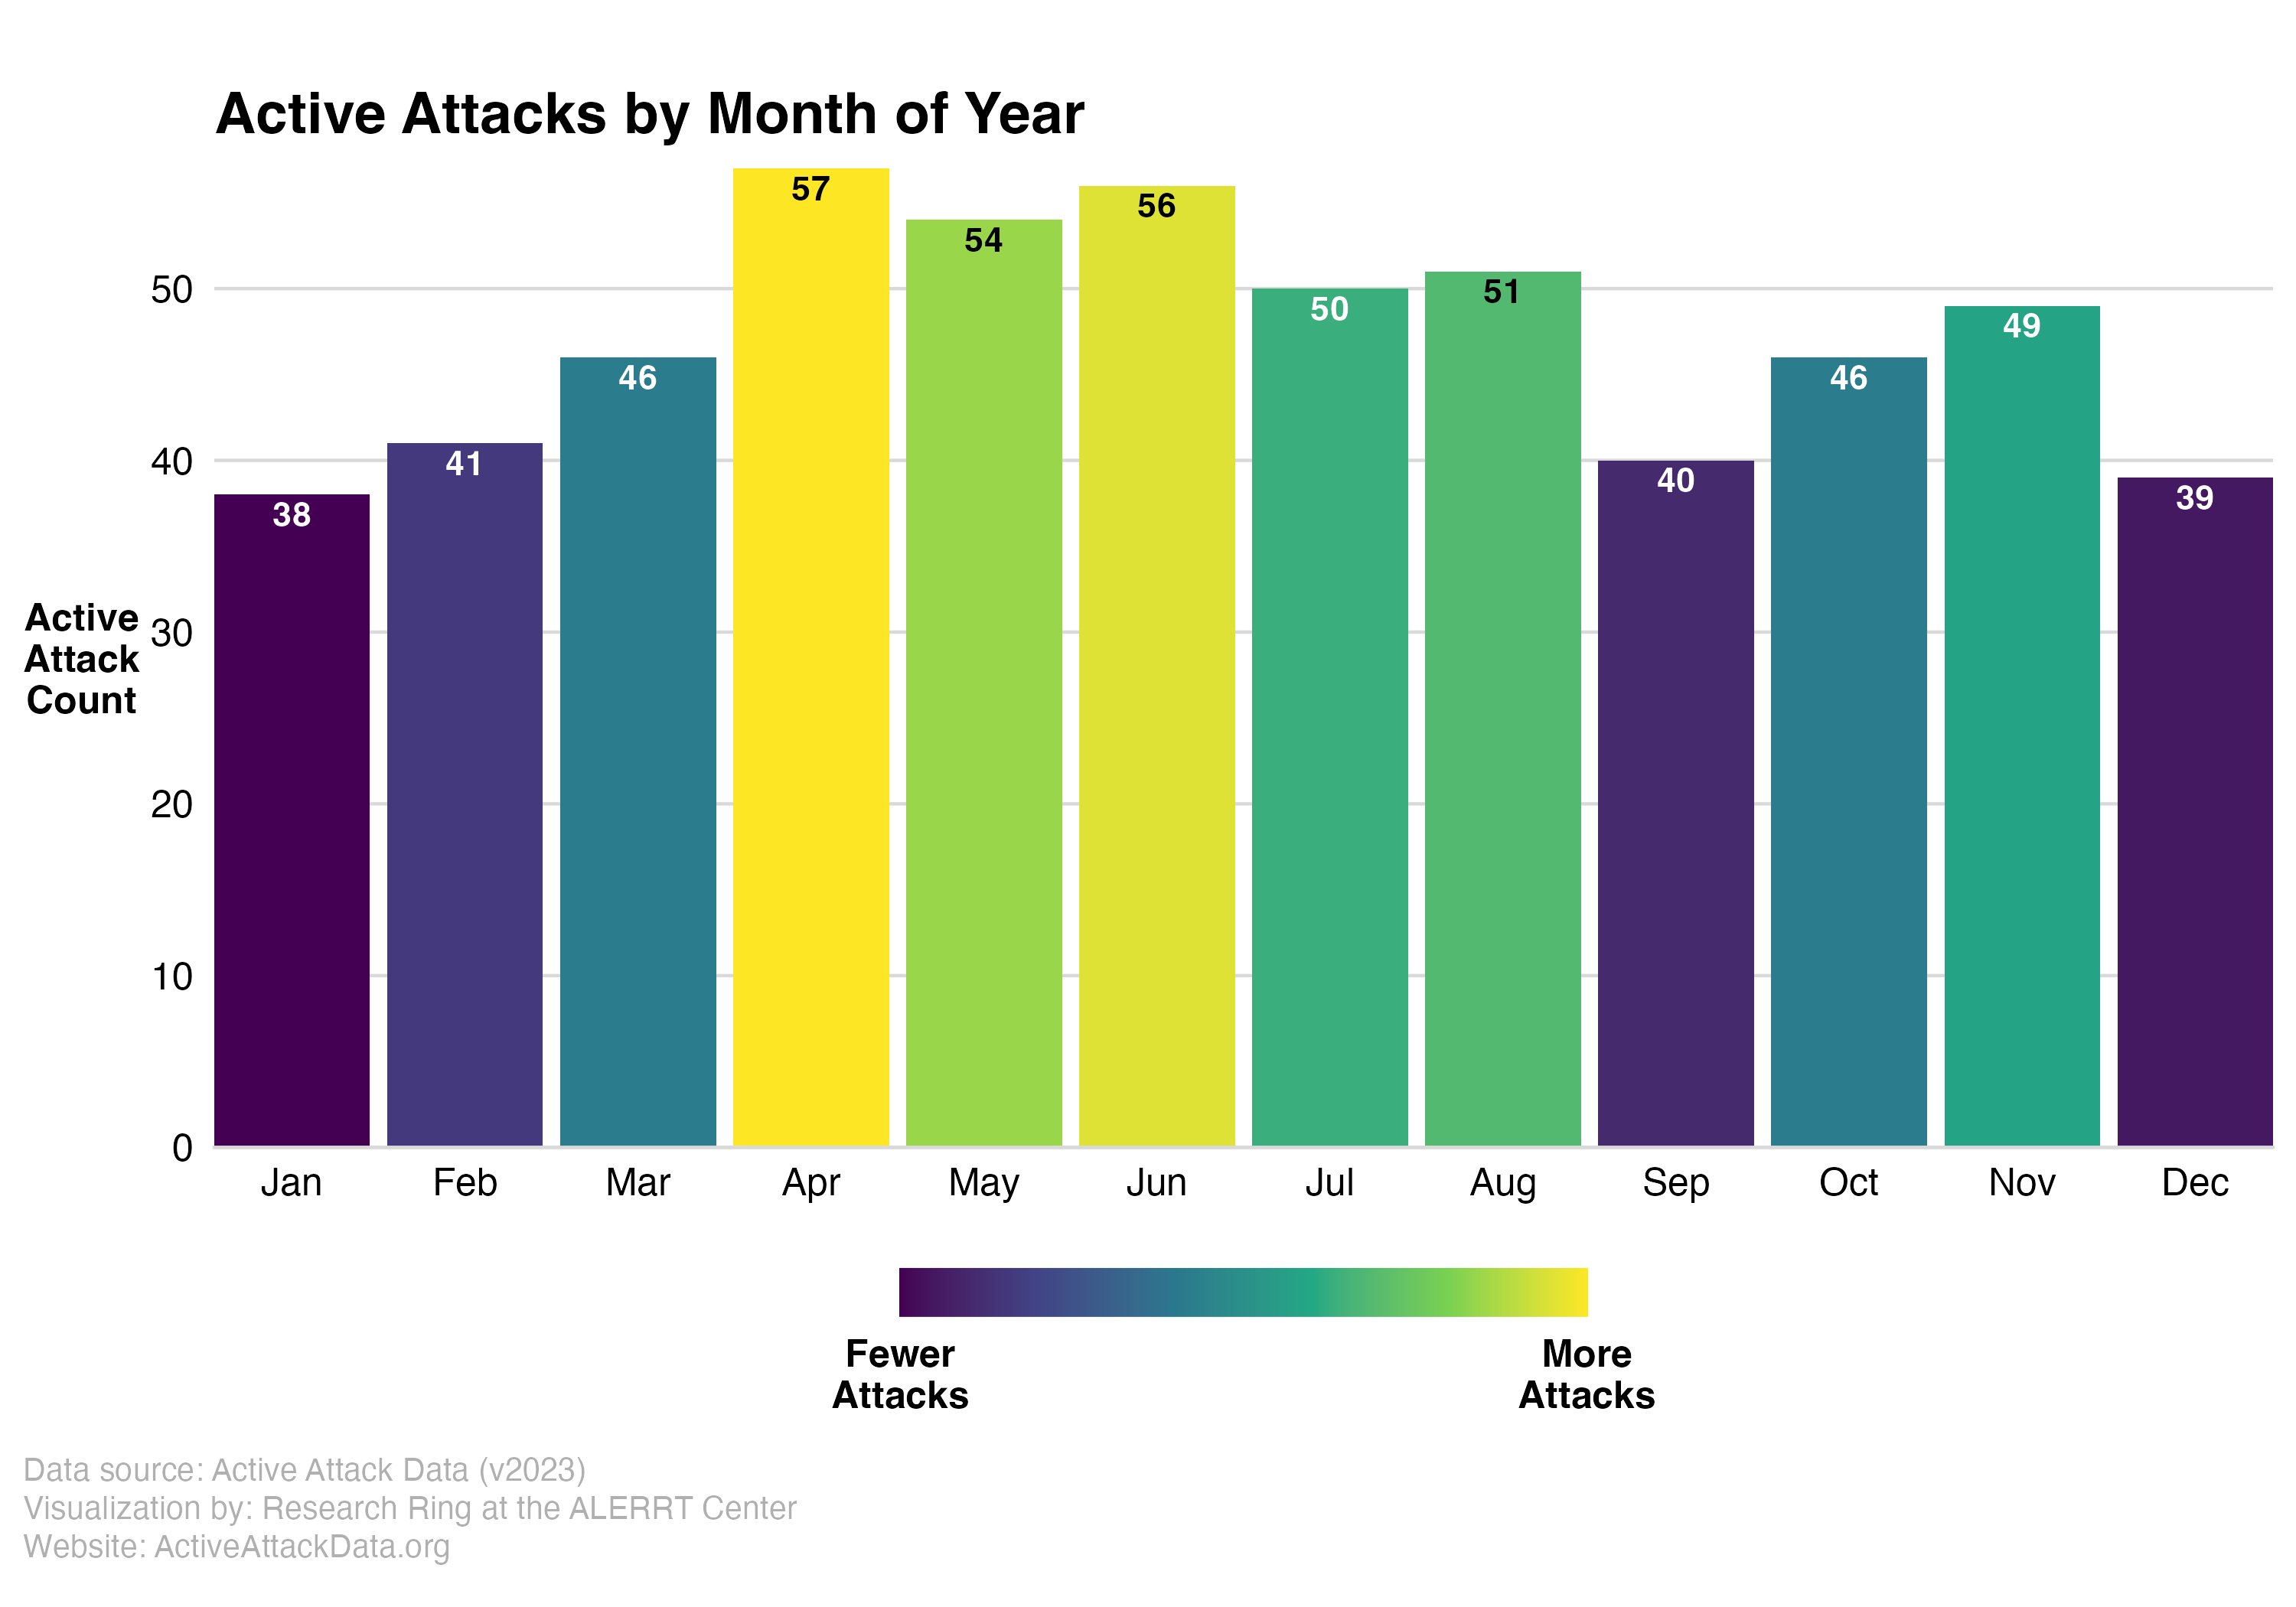
By Month
In contrast to the obvious upward trend in attacks across years, there appear to be only a modest trend related to months of the year. Active Attacks tend to peak during the warmer months of the year (e.g., April through August account for 47.6% of attacks), though this trend is not a strong one. The relationship with temperature is similar to trends observed for certain types of violent crime (e.g., aggravated assault, homicide) that also tend to peak during the warmest parts of the year.
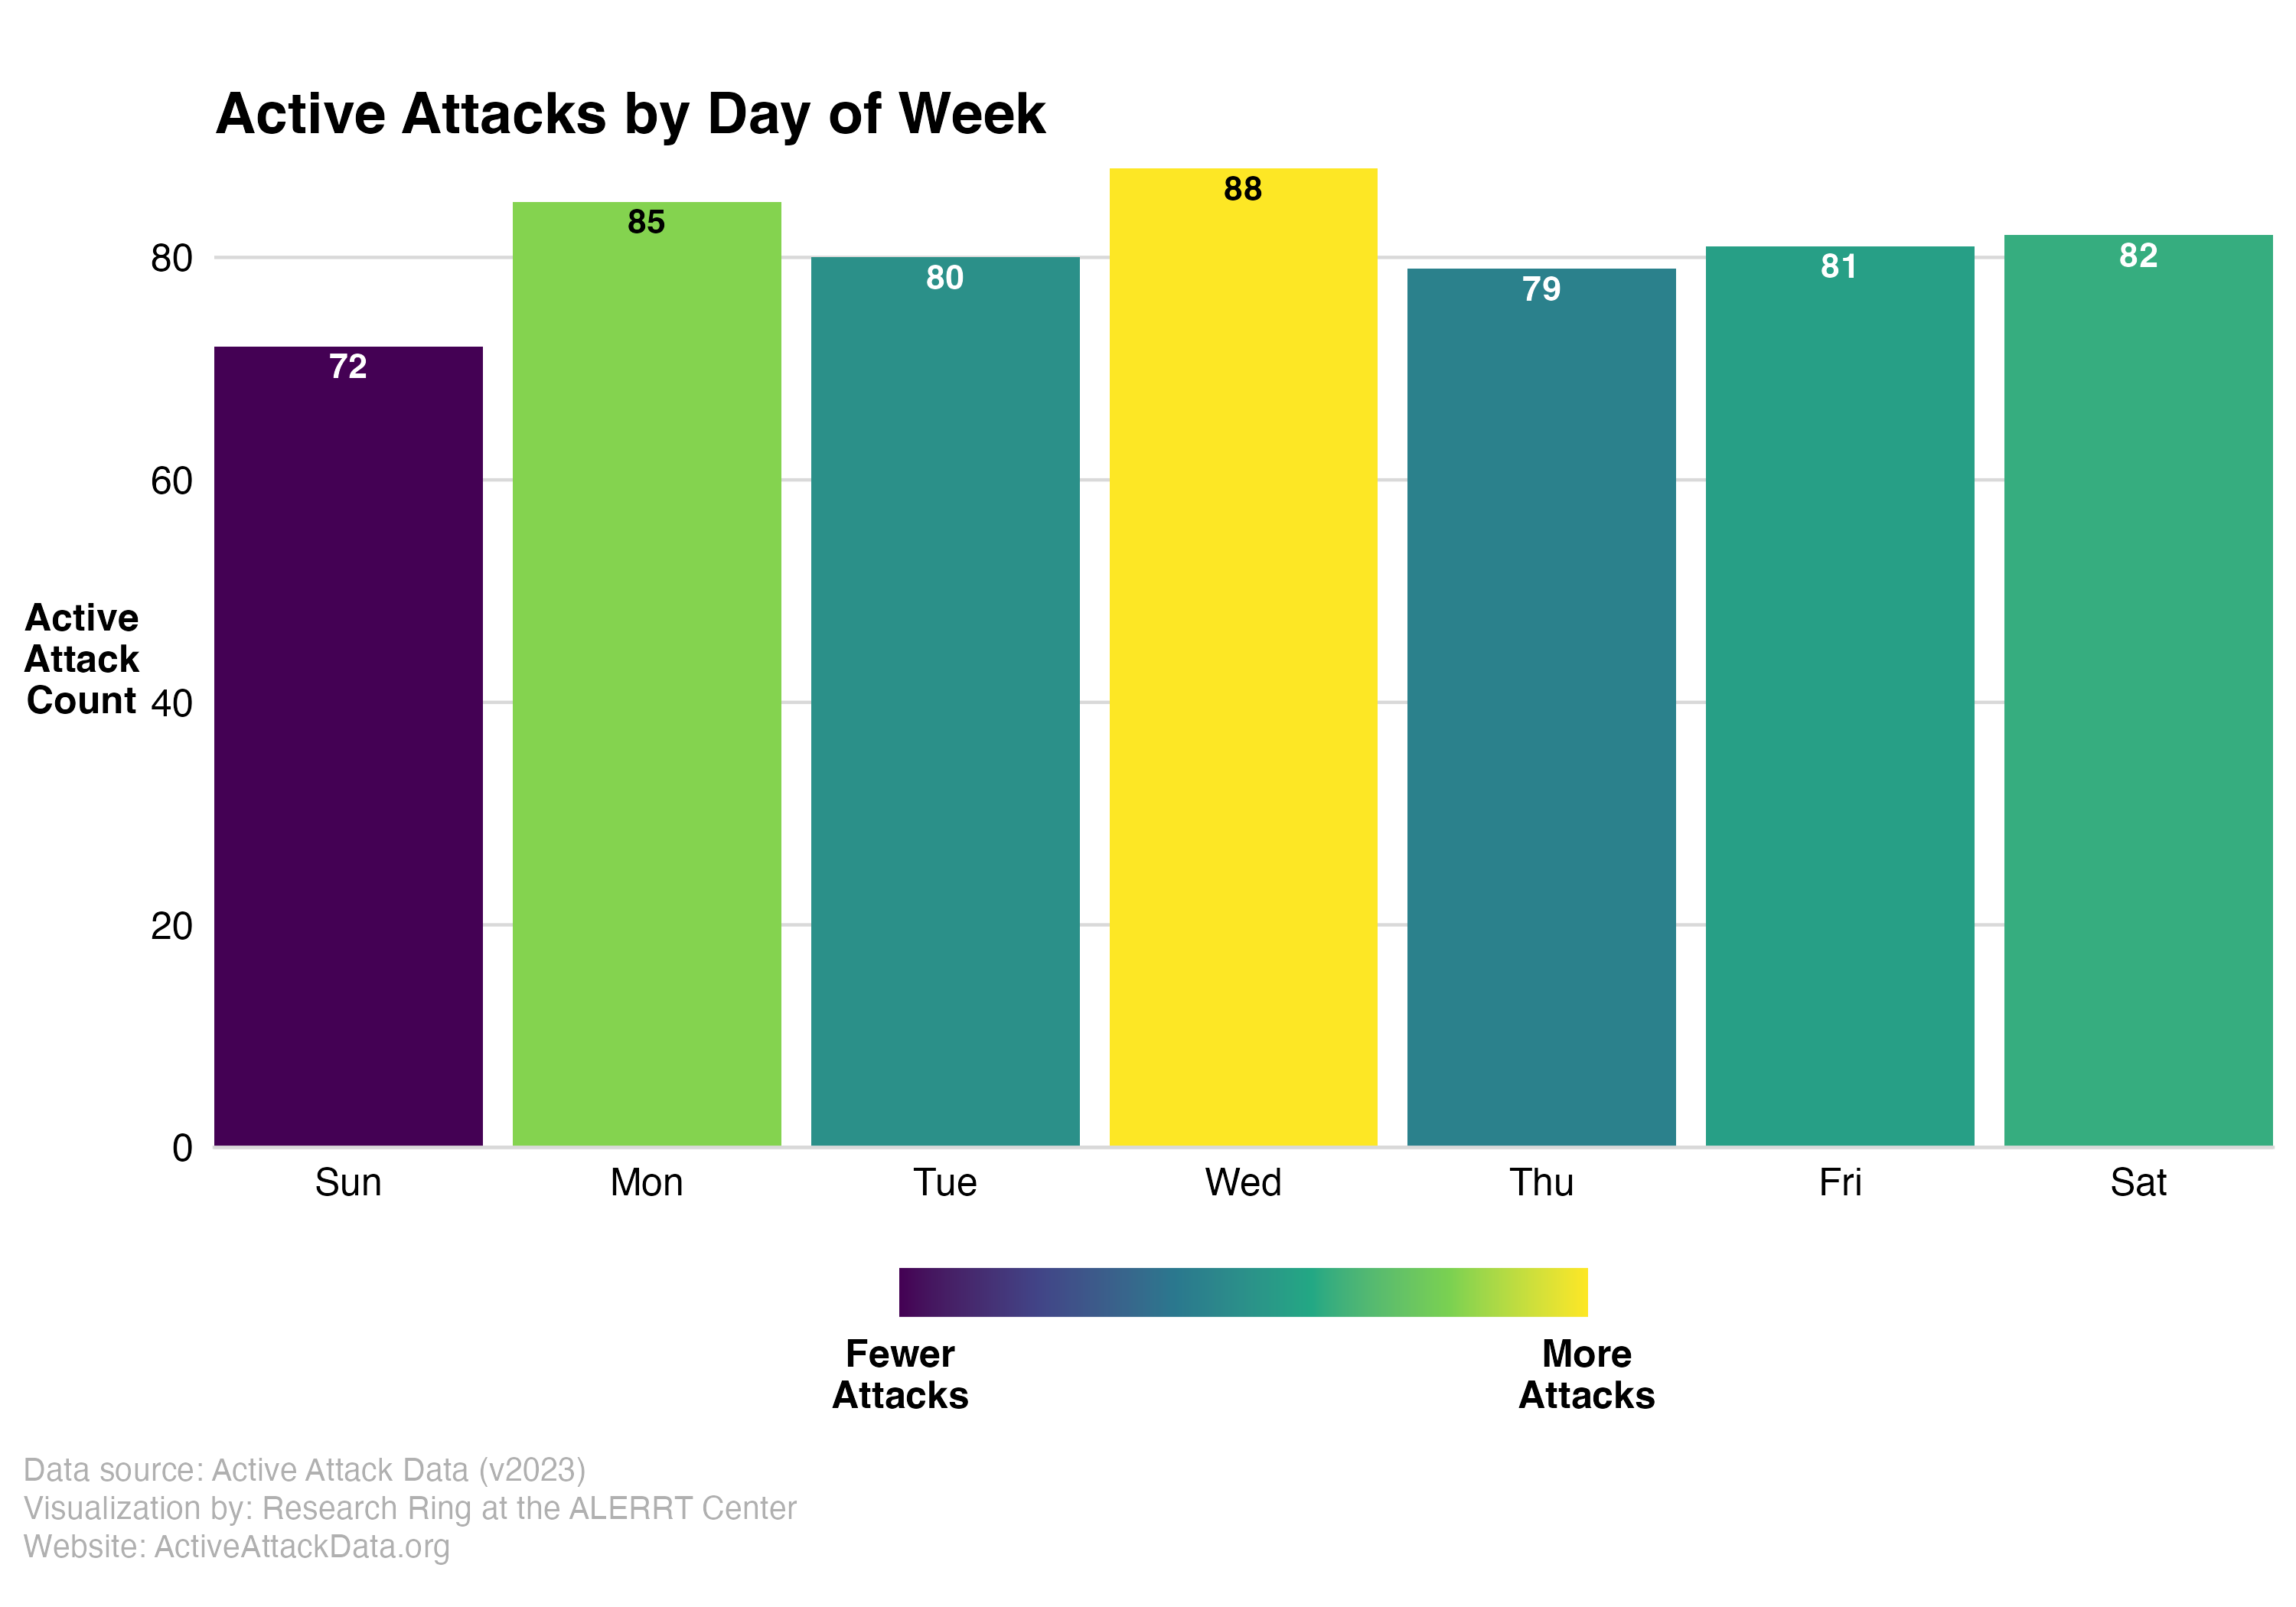
By Day of the Week
Active attacks share no observable association with day of the week. This can be seen by the flat distribution of attacks across the week. So while there may be trends by year and month, attacks appear to be nearly equally likely on any given day of the week.
By Hour of the Day
Active attacks tend to cluster around midday. While attacks that begin at midday exactly are relatively infrequent (only 3.7% of attacks), the majority of attacks occur immediately before midday (8-11am hours account for 25.6% of attacks) or after midday (1-4pm hours account for 24.3% of attacks).

Many in the media attempt to create a profile describing the “average” attacker. The data do not support a profile beyond sex and number of attackers. Attackers were male 95.9% of the time. Furthermore, the attacker commits the attack by him/herself 97.5% of the time. Beyond these characteristics, attackers are somewhat more varied.
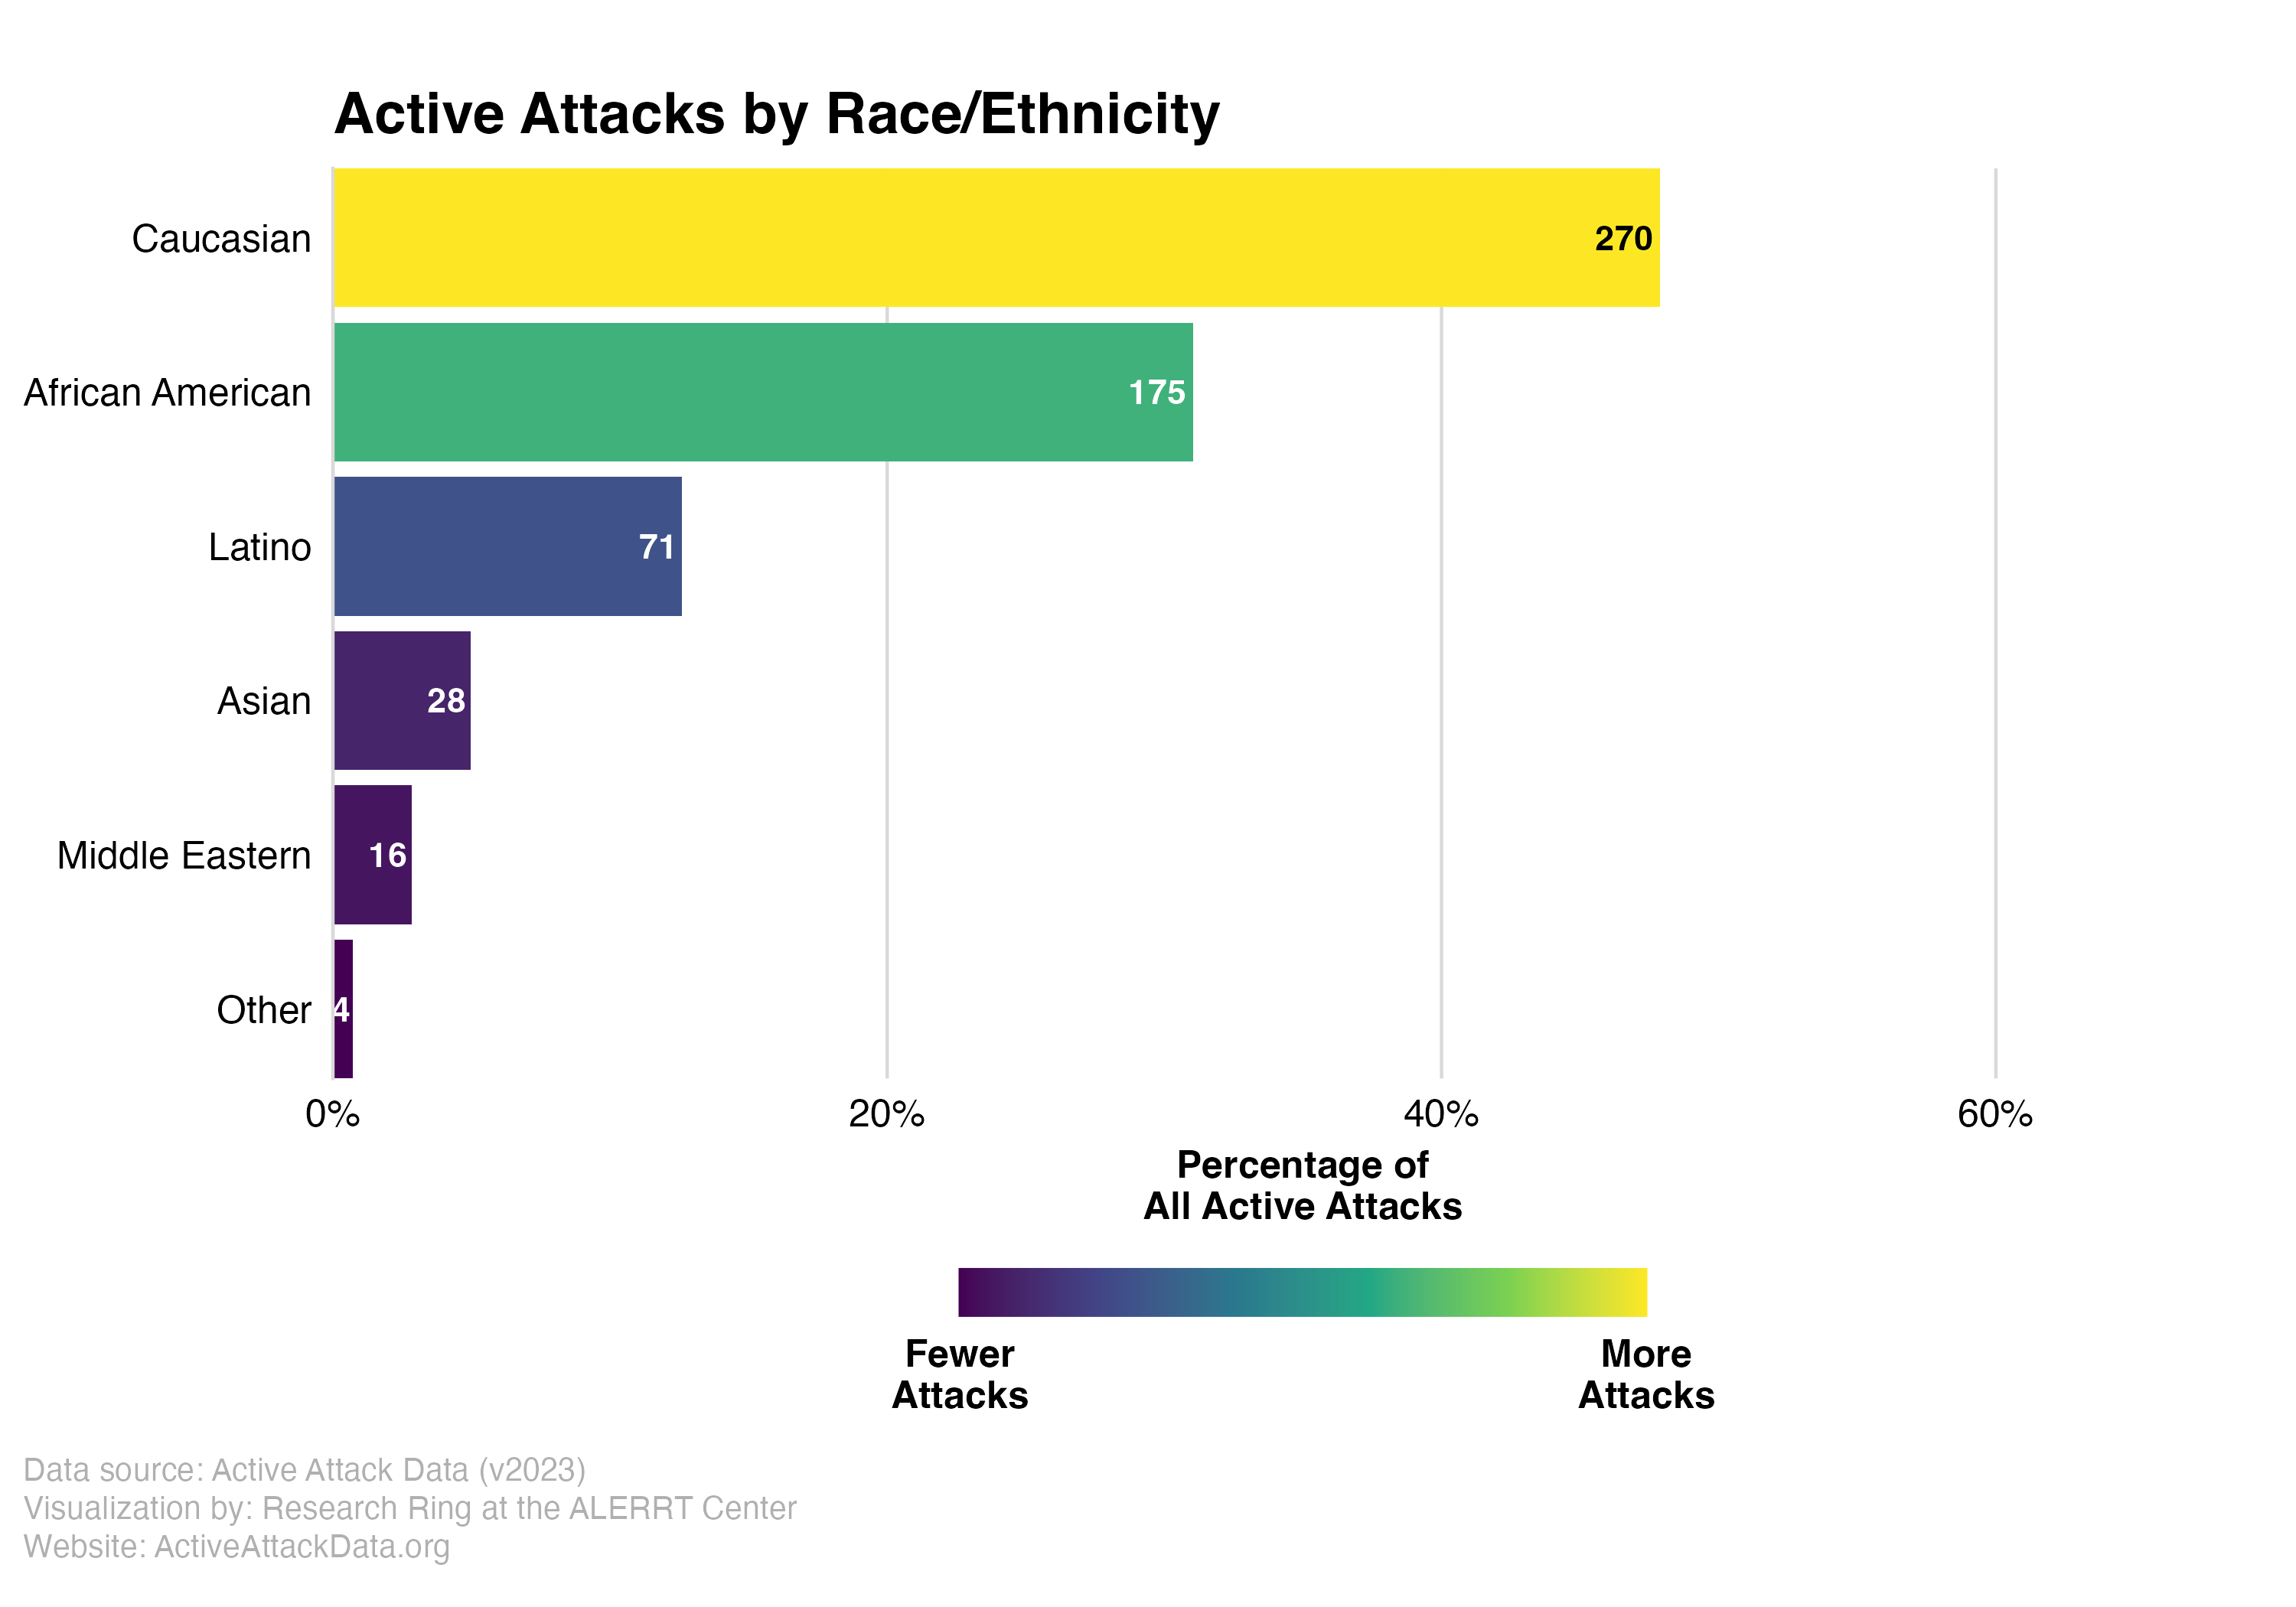
Attacker Race/Ethnicity
The racial/ethnic makeup of attackers roughly mirrored that of the general population, though Caucasians were under-represented and African Americans were over-represented. Most attackers were either Caucasian (46.1%) or African American (29.5%). All other racial/ethnic groups (e.g., Latino, Asian, Middle Eastern) only accounted for around a quarter of attackers (24.4%).
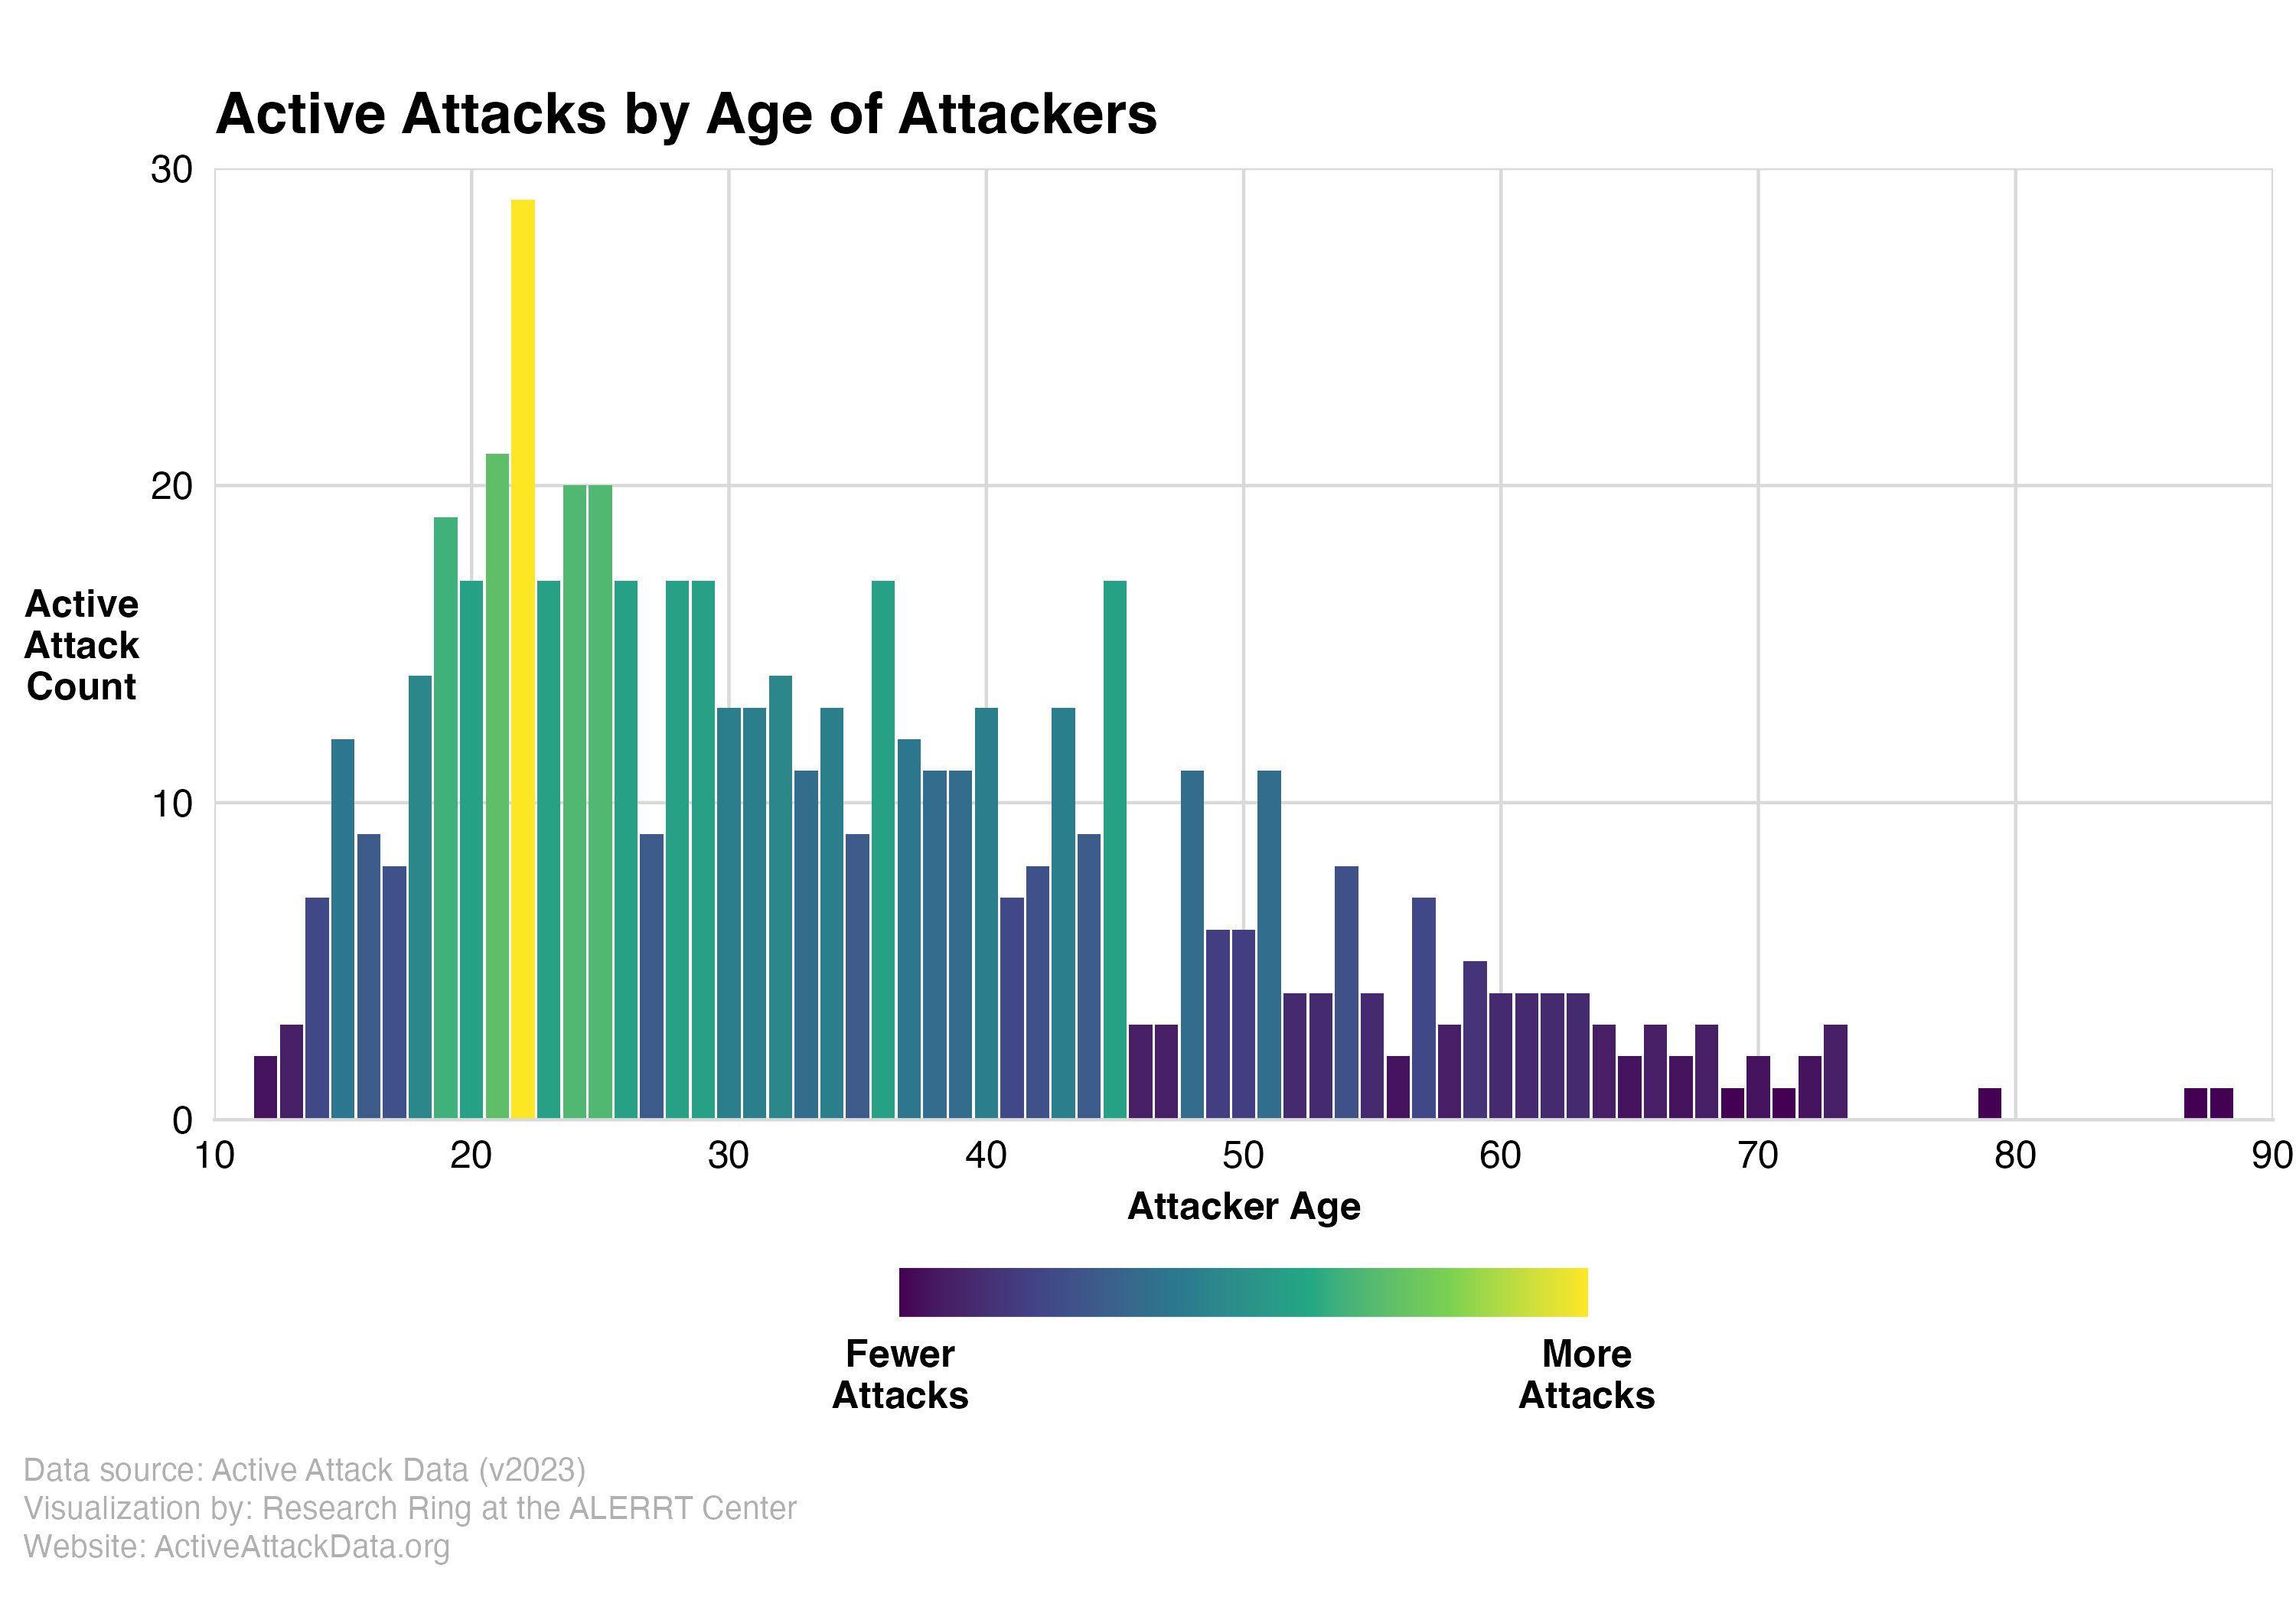
Attacker Age
While the median age of attackers was 31.5 years old, attackers ranged in age from 12 to 88. Attackers in their twenties were the most plentiful group compared to any other decade of life. The age-trend of attackers adheres to the classic “age-crime curve” observed for nearly every crime type, peaking in late adolescence/early adulthood and steadily declining throughout the rest of the life course.
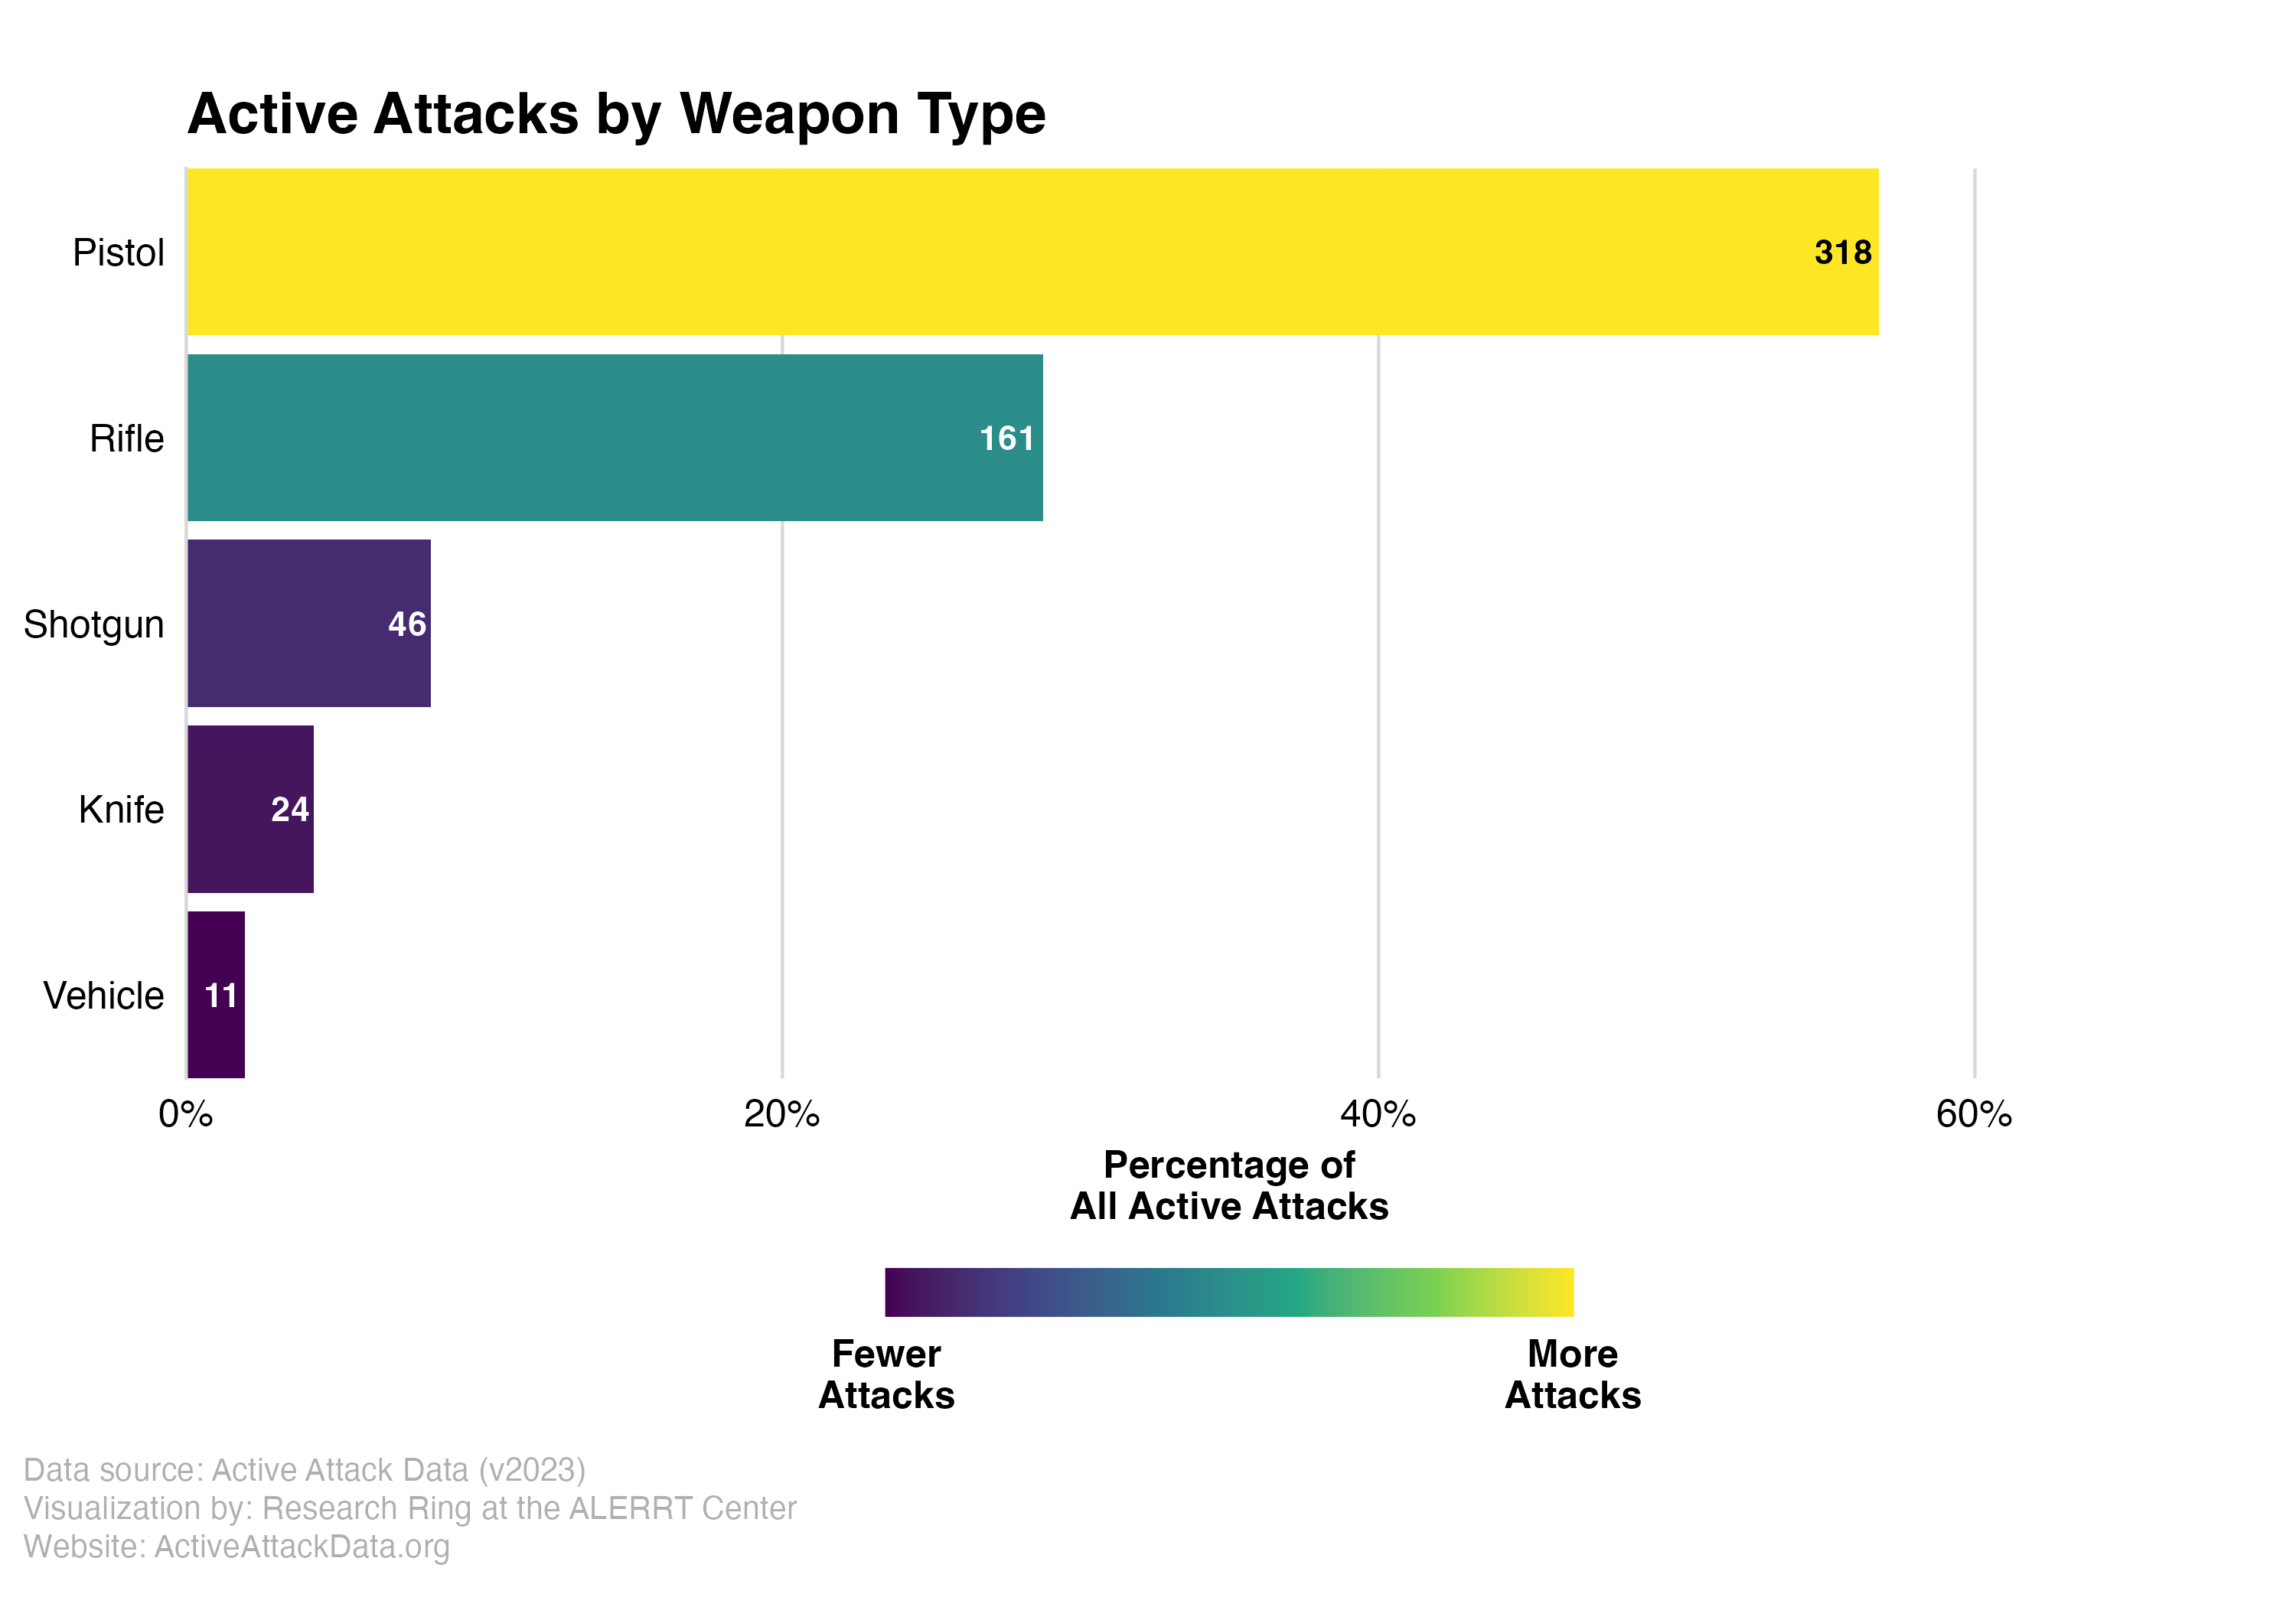
Weapon Type
Active attacks can be carried out using any weapon though, in reality, only a very small minority of attacks (6.7%) were carried out using weapons other than firearms (e.g., knife, vehicle). Among types of firearms, handguns made up a clear majority (55.4%), while rifles (e.g., AR15s) and shotguns were used in 28.5% and 8.2% of the time, respectively.
Defining where an attack occurred can be difficult. For instance, on January 8, 2011 a shooter attacked a meeting for U.S. Representative Gabrielle Giffords. This attack happened in the parking lot of a local Tucson grocery store. Had the attack happened in the store it would have been classified as a business event; however, since the attack occurred in the parking lot it is coded as an outdoor event. Bear these fine distinctions in mind when examining the visualizations in this section.
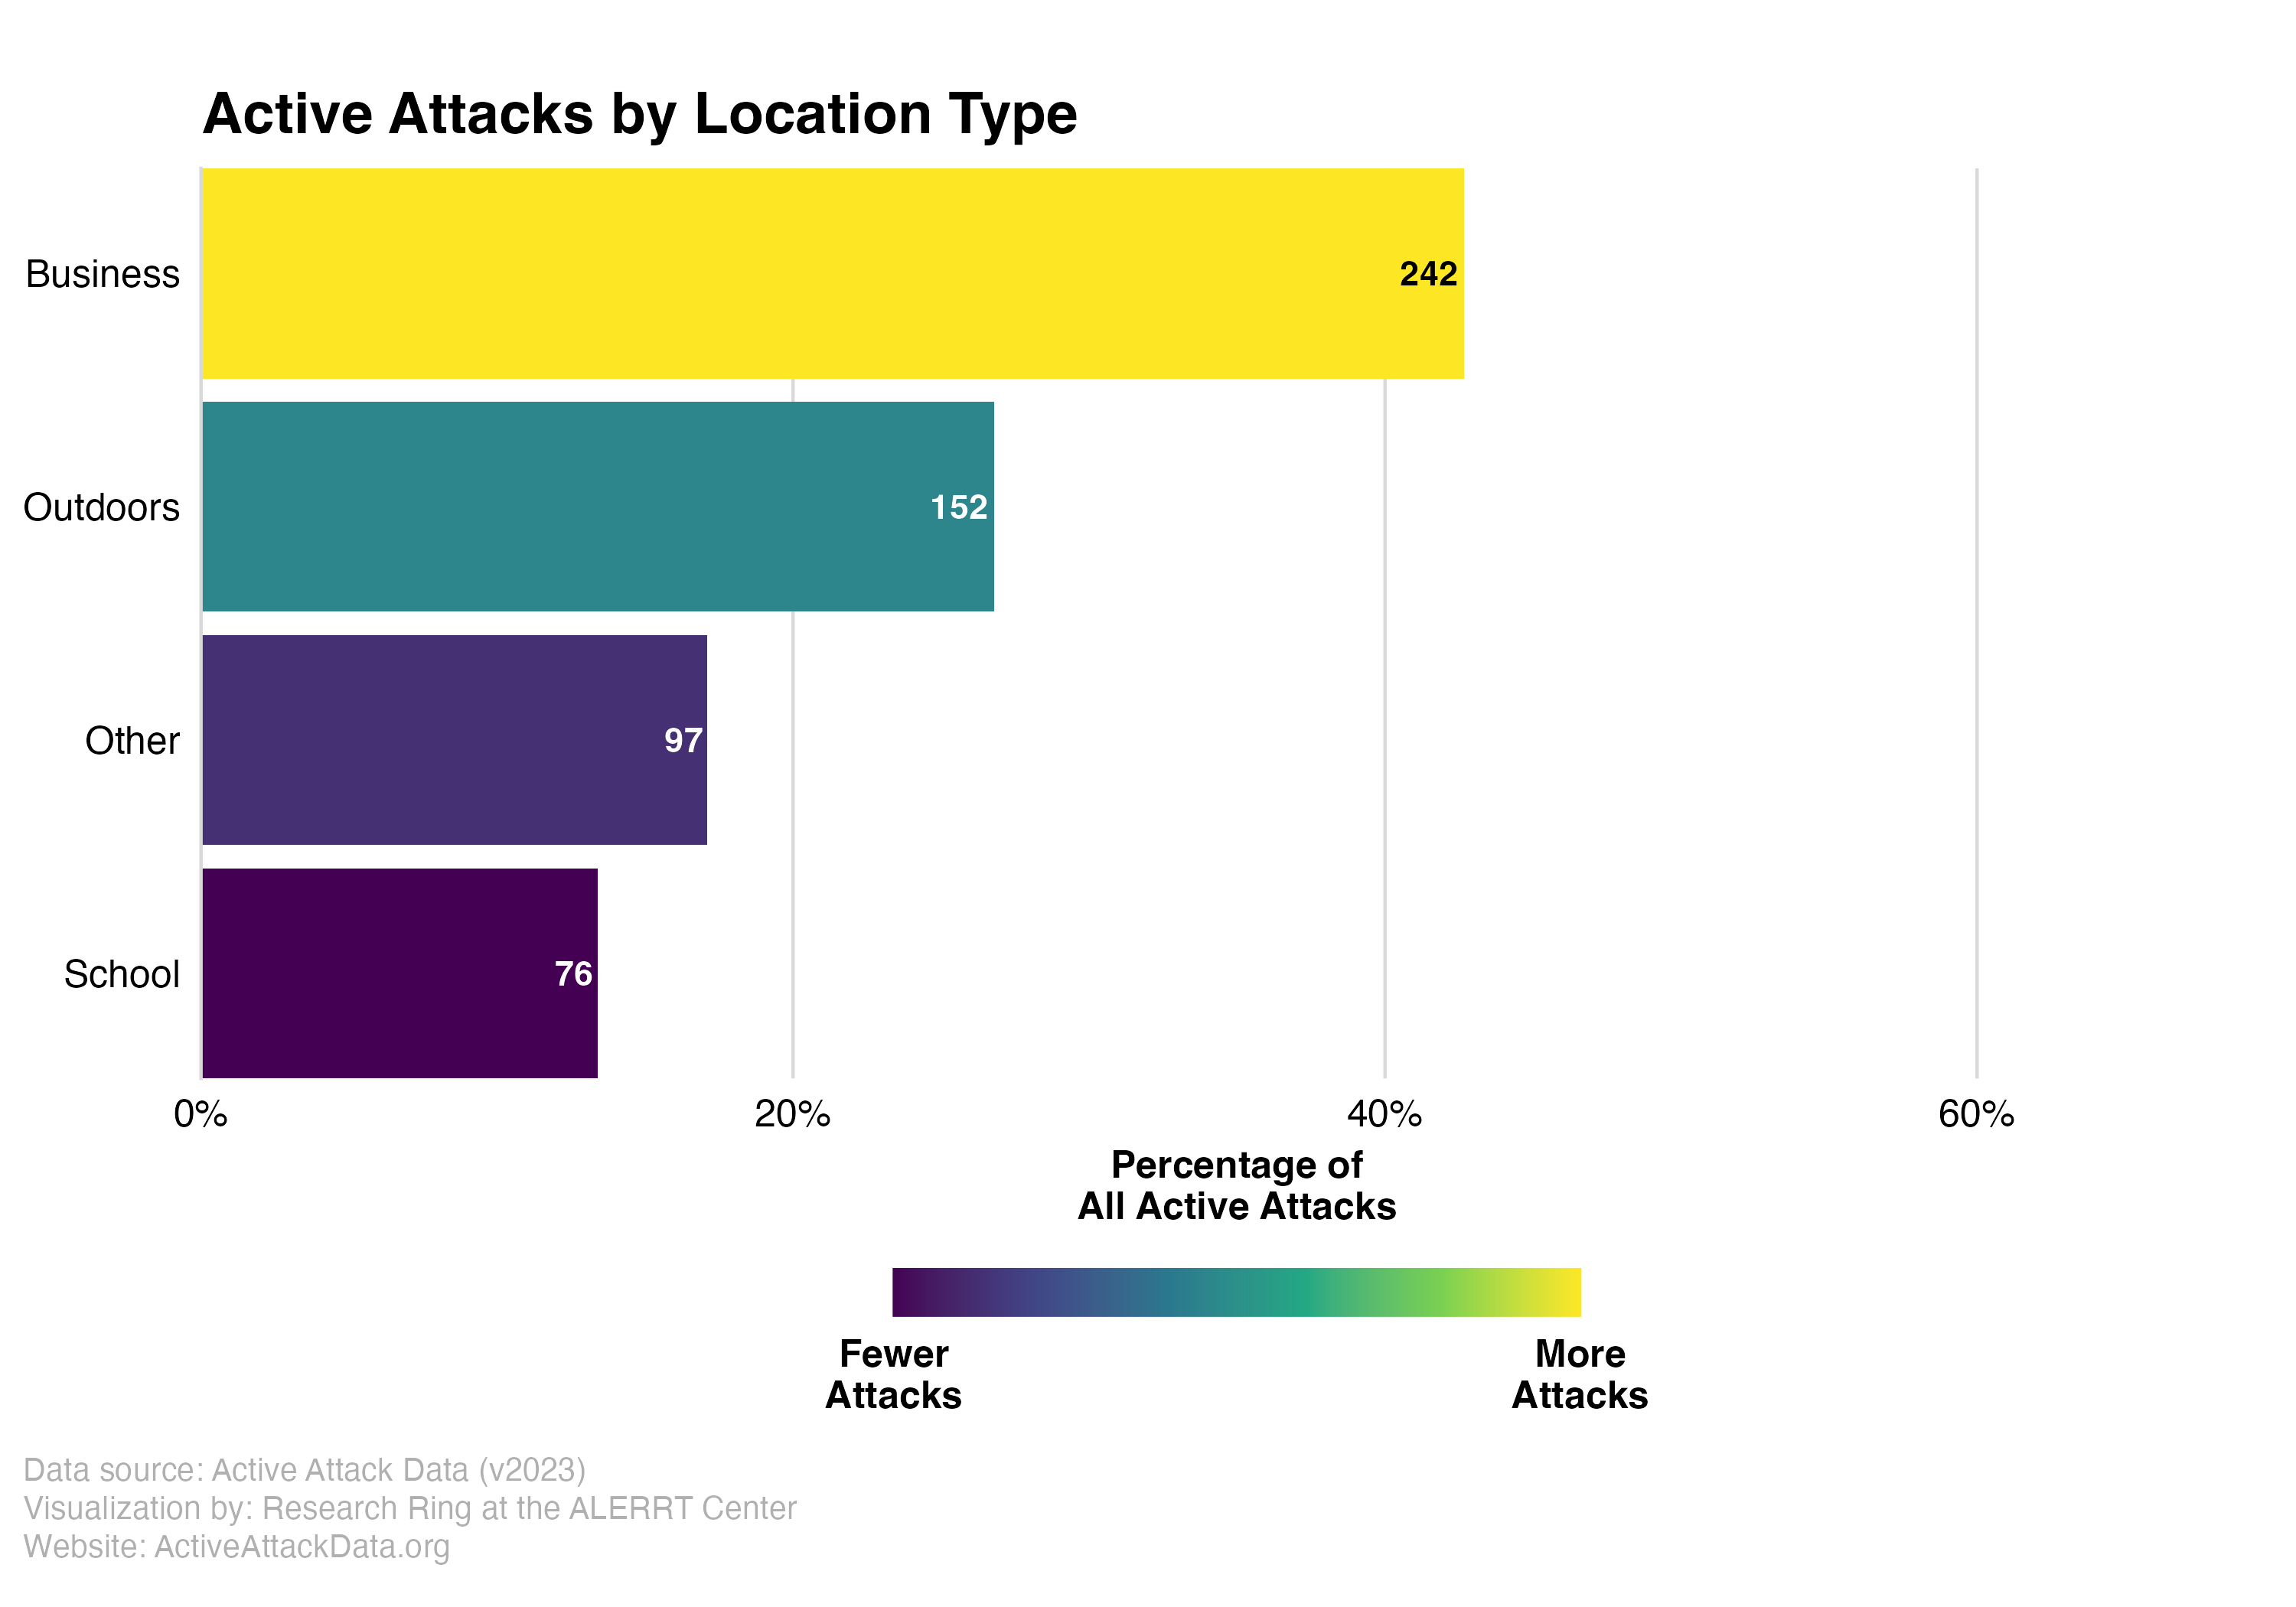
Location Type
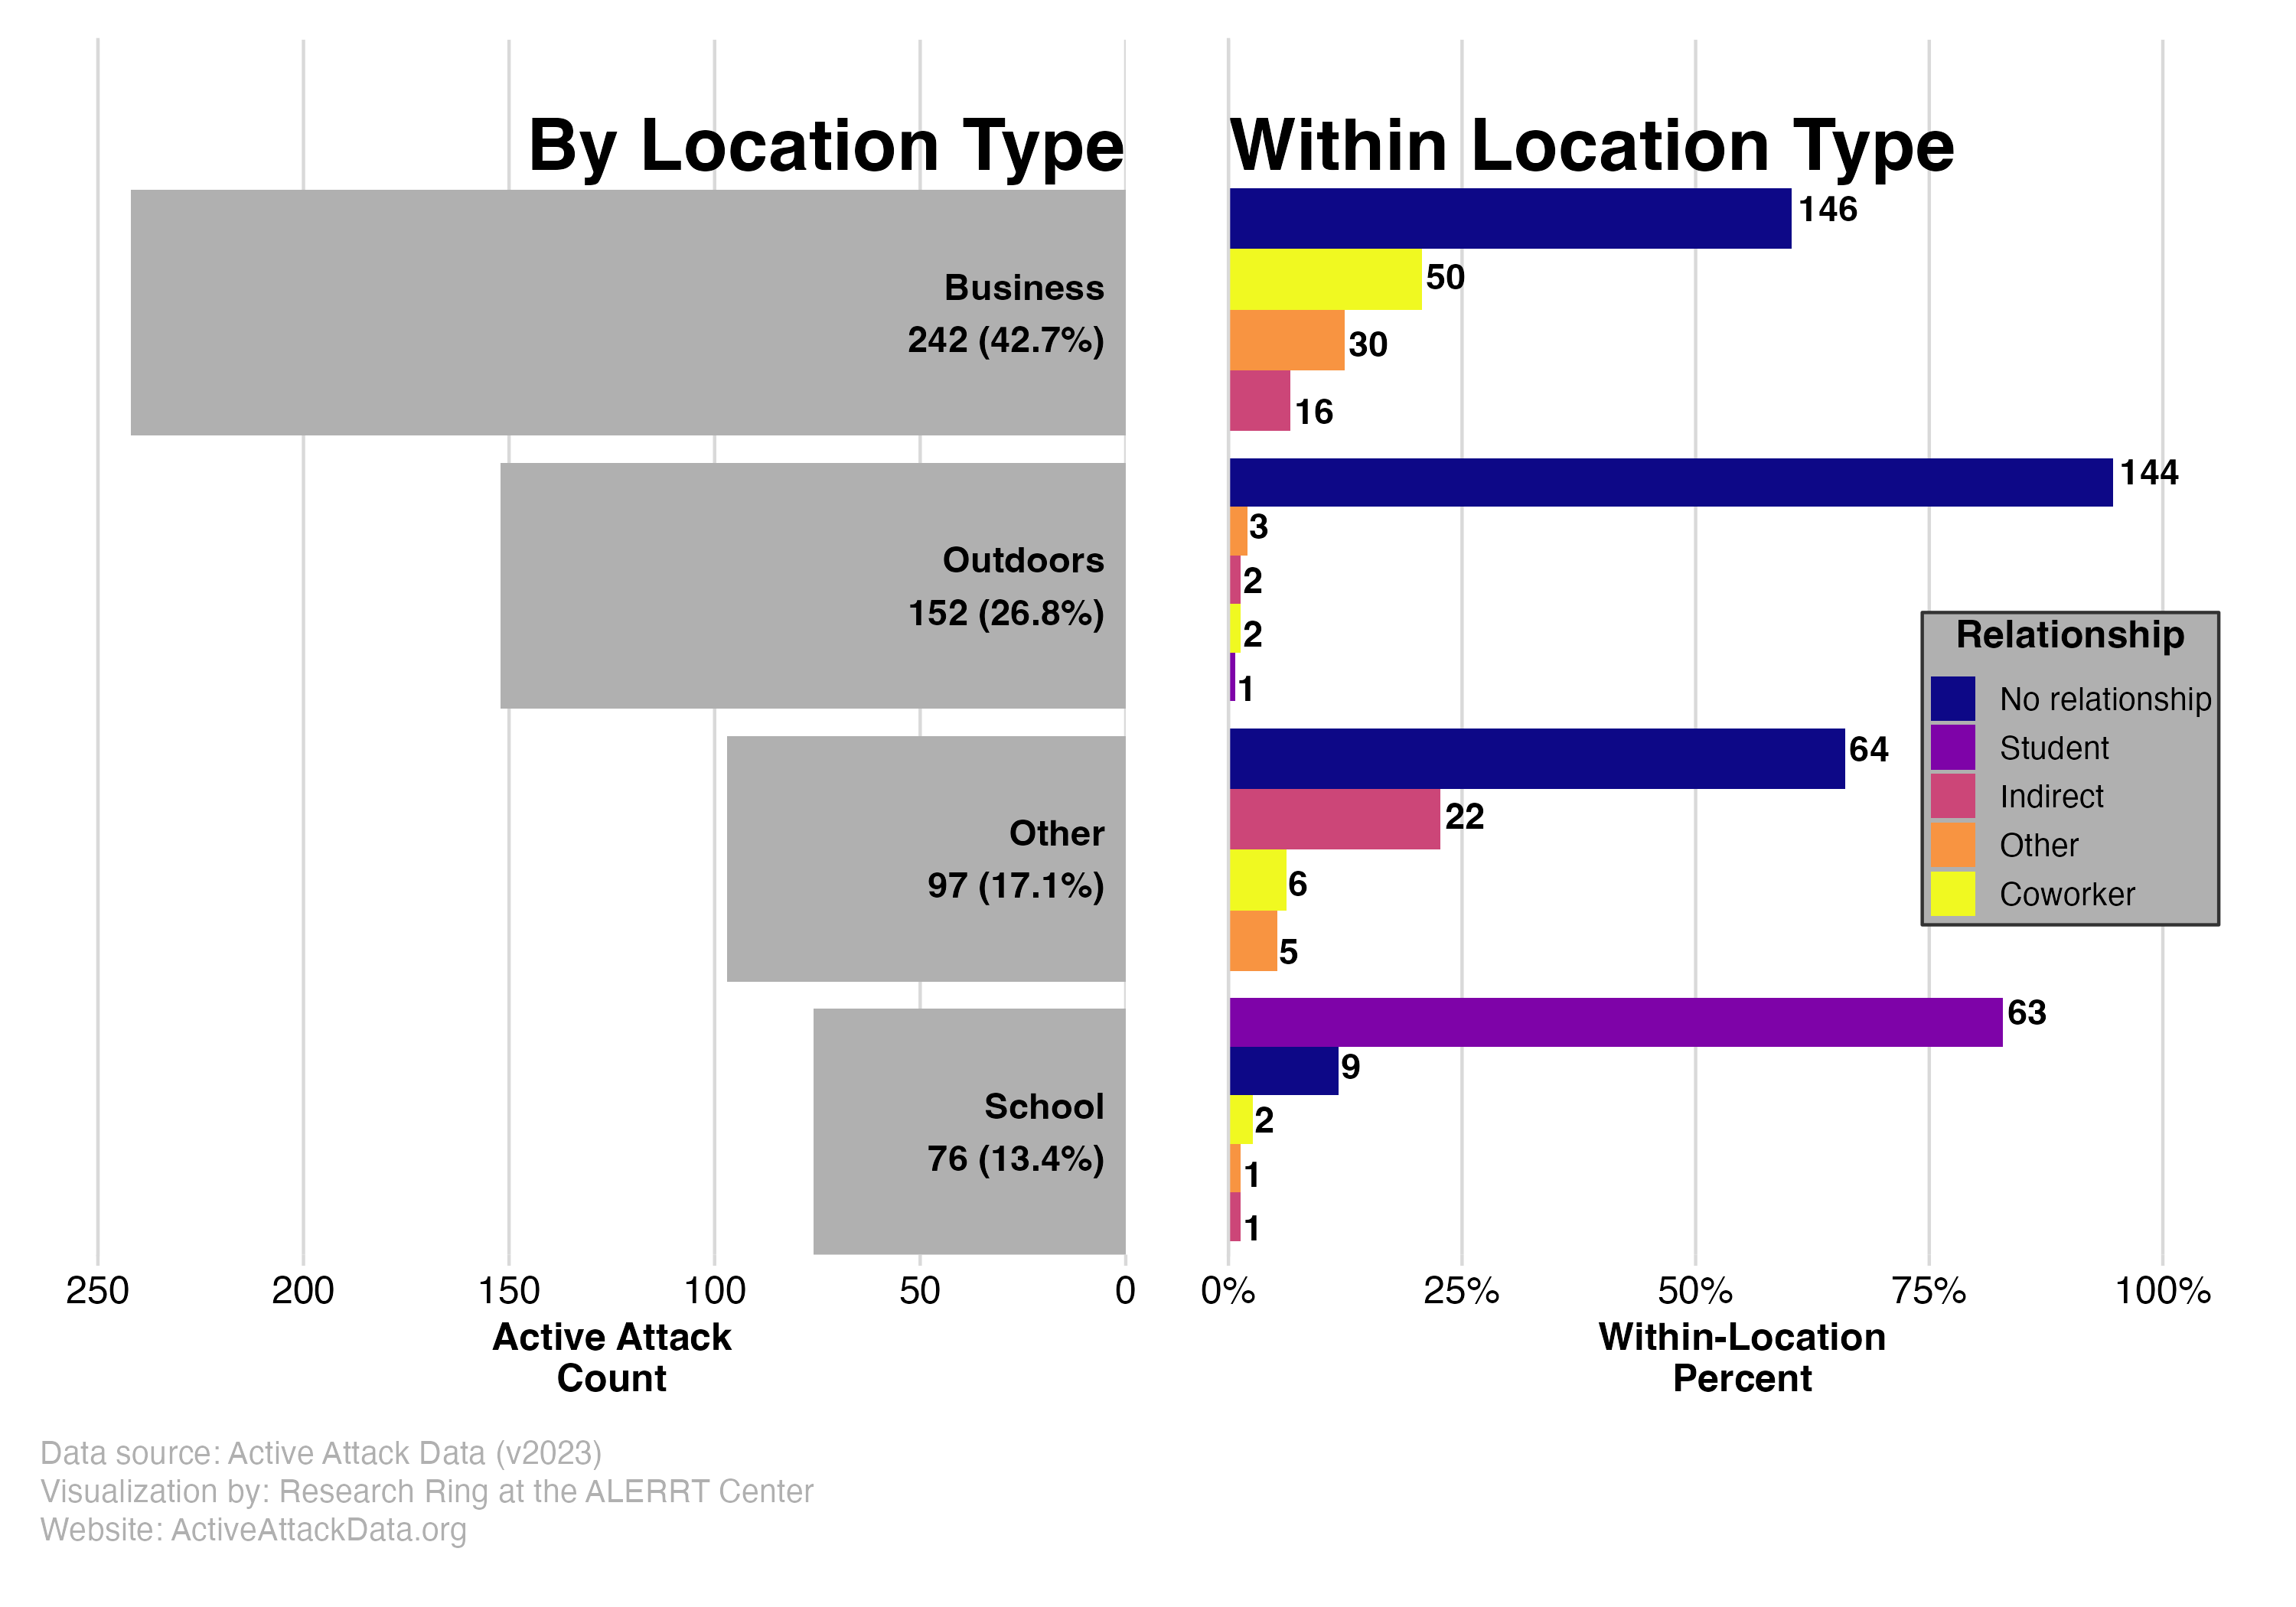
As seen here, the plurality of events happen at places of business (41.5%). Places of business include factories/warehouse, retail locations, and office space. Around a quarter of attacks (27.8%) happened in public (outdoor) spaces. Schools were attacked 80 times (13.4%). These events are aggregated and include attacks on all types of educational facilities, including K-12 and institutes of higher education. Lastly, 103 attacks (17.3%) happened at “Other” locations (e.g., houses of worship).
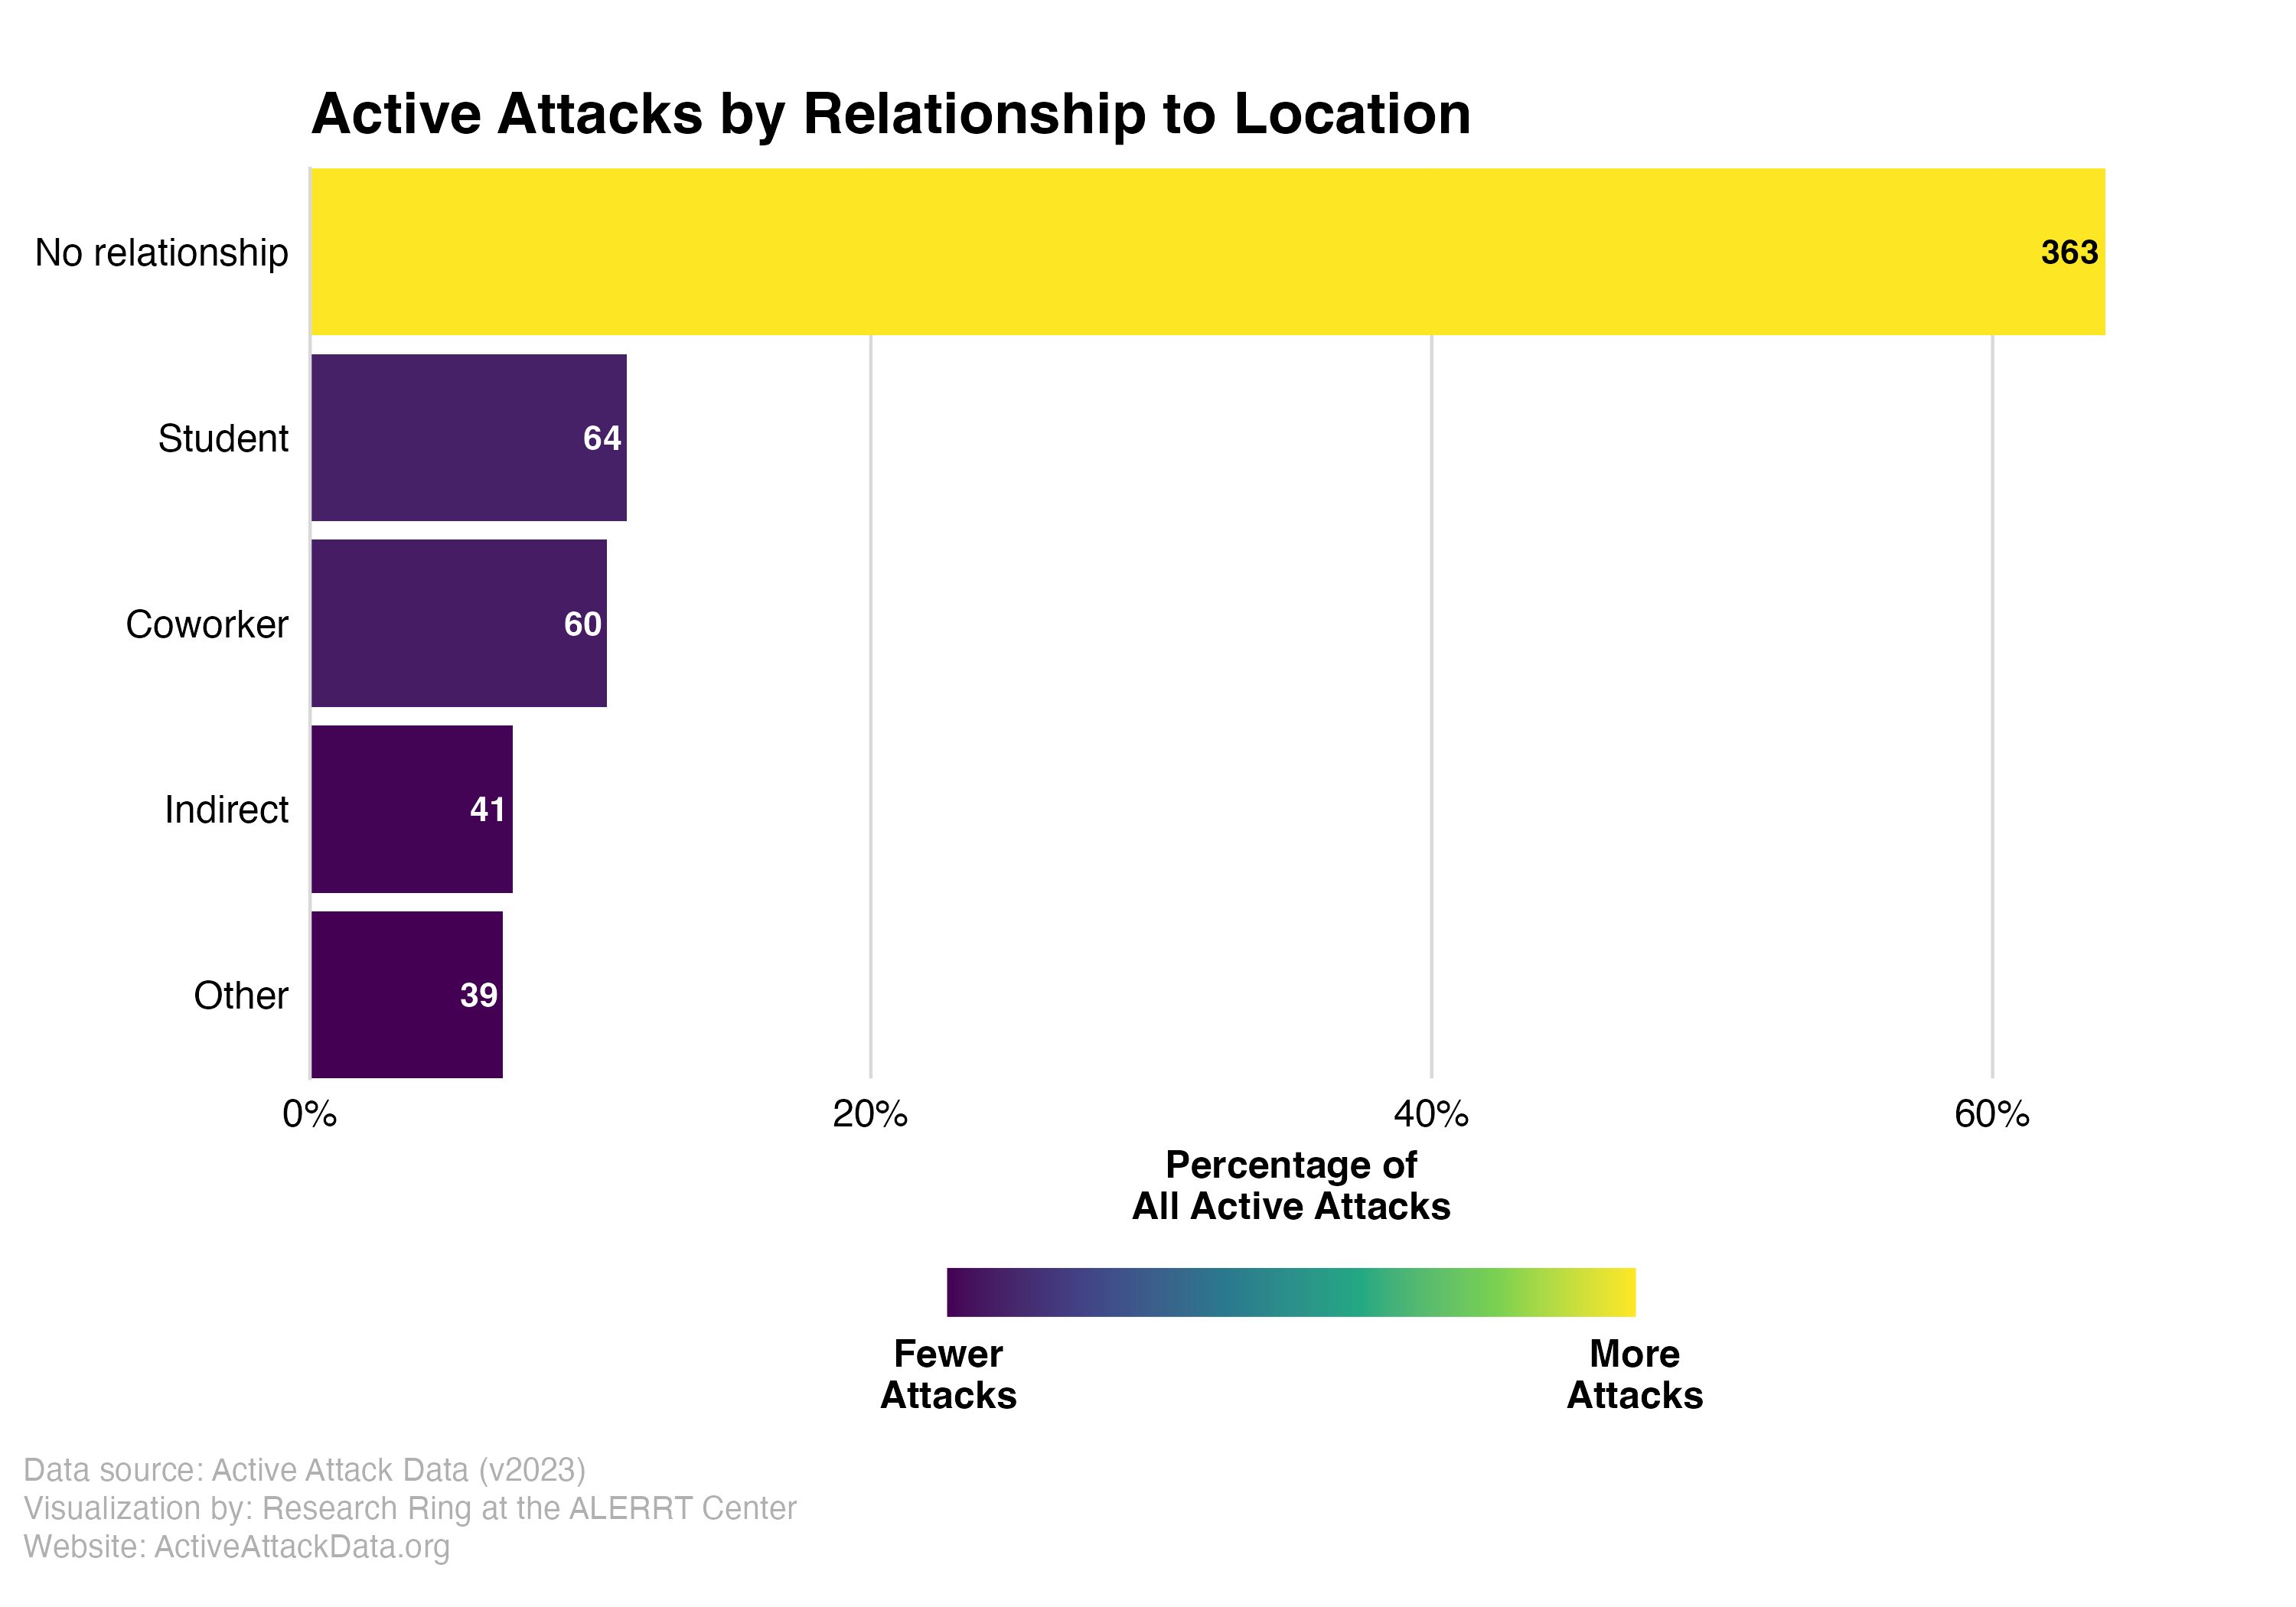
Relationship to Location
In a vast majority of attacks (65% of all attacks), the attacker(s) had no prior association with the attack location. For attackers with some relationship to the location, former/current students (11.2%) and current/former employees (10.4%) were the most common relationship types, followed by indirect (e.g., the attacker’s wife was associated with the location; (6.9%)) and “other” associations (6.5%).
Relationship by Location Type
When looking within location types, we find that most attackers had no relationship to the locations. Going beyond attackers with no relationship,
we find some interesting patterns. Despite making up only 10.4 of attackers generally, attackers of businesses were current/former employees 20.6% of the time. A similar trend is observable in schools, though in this case, the vast majority of attackers were current/former students (82.5%). Only a small percentage of attacks on schools (12.5%) were perpetrated by an attacker with no relationship to the school.
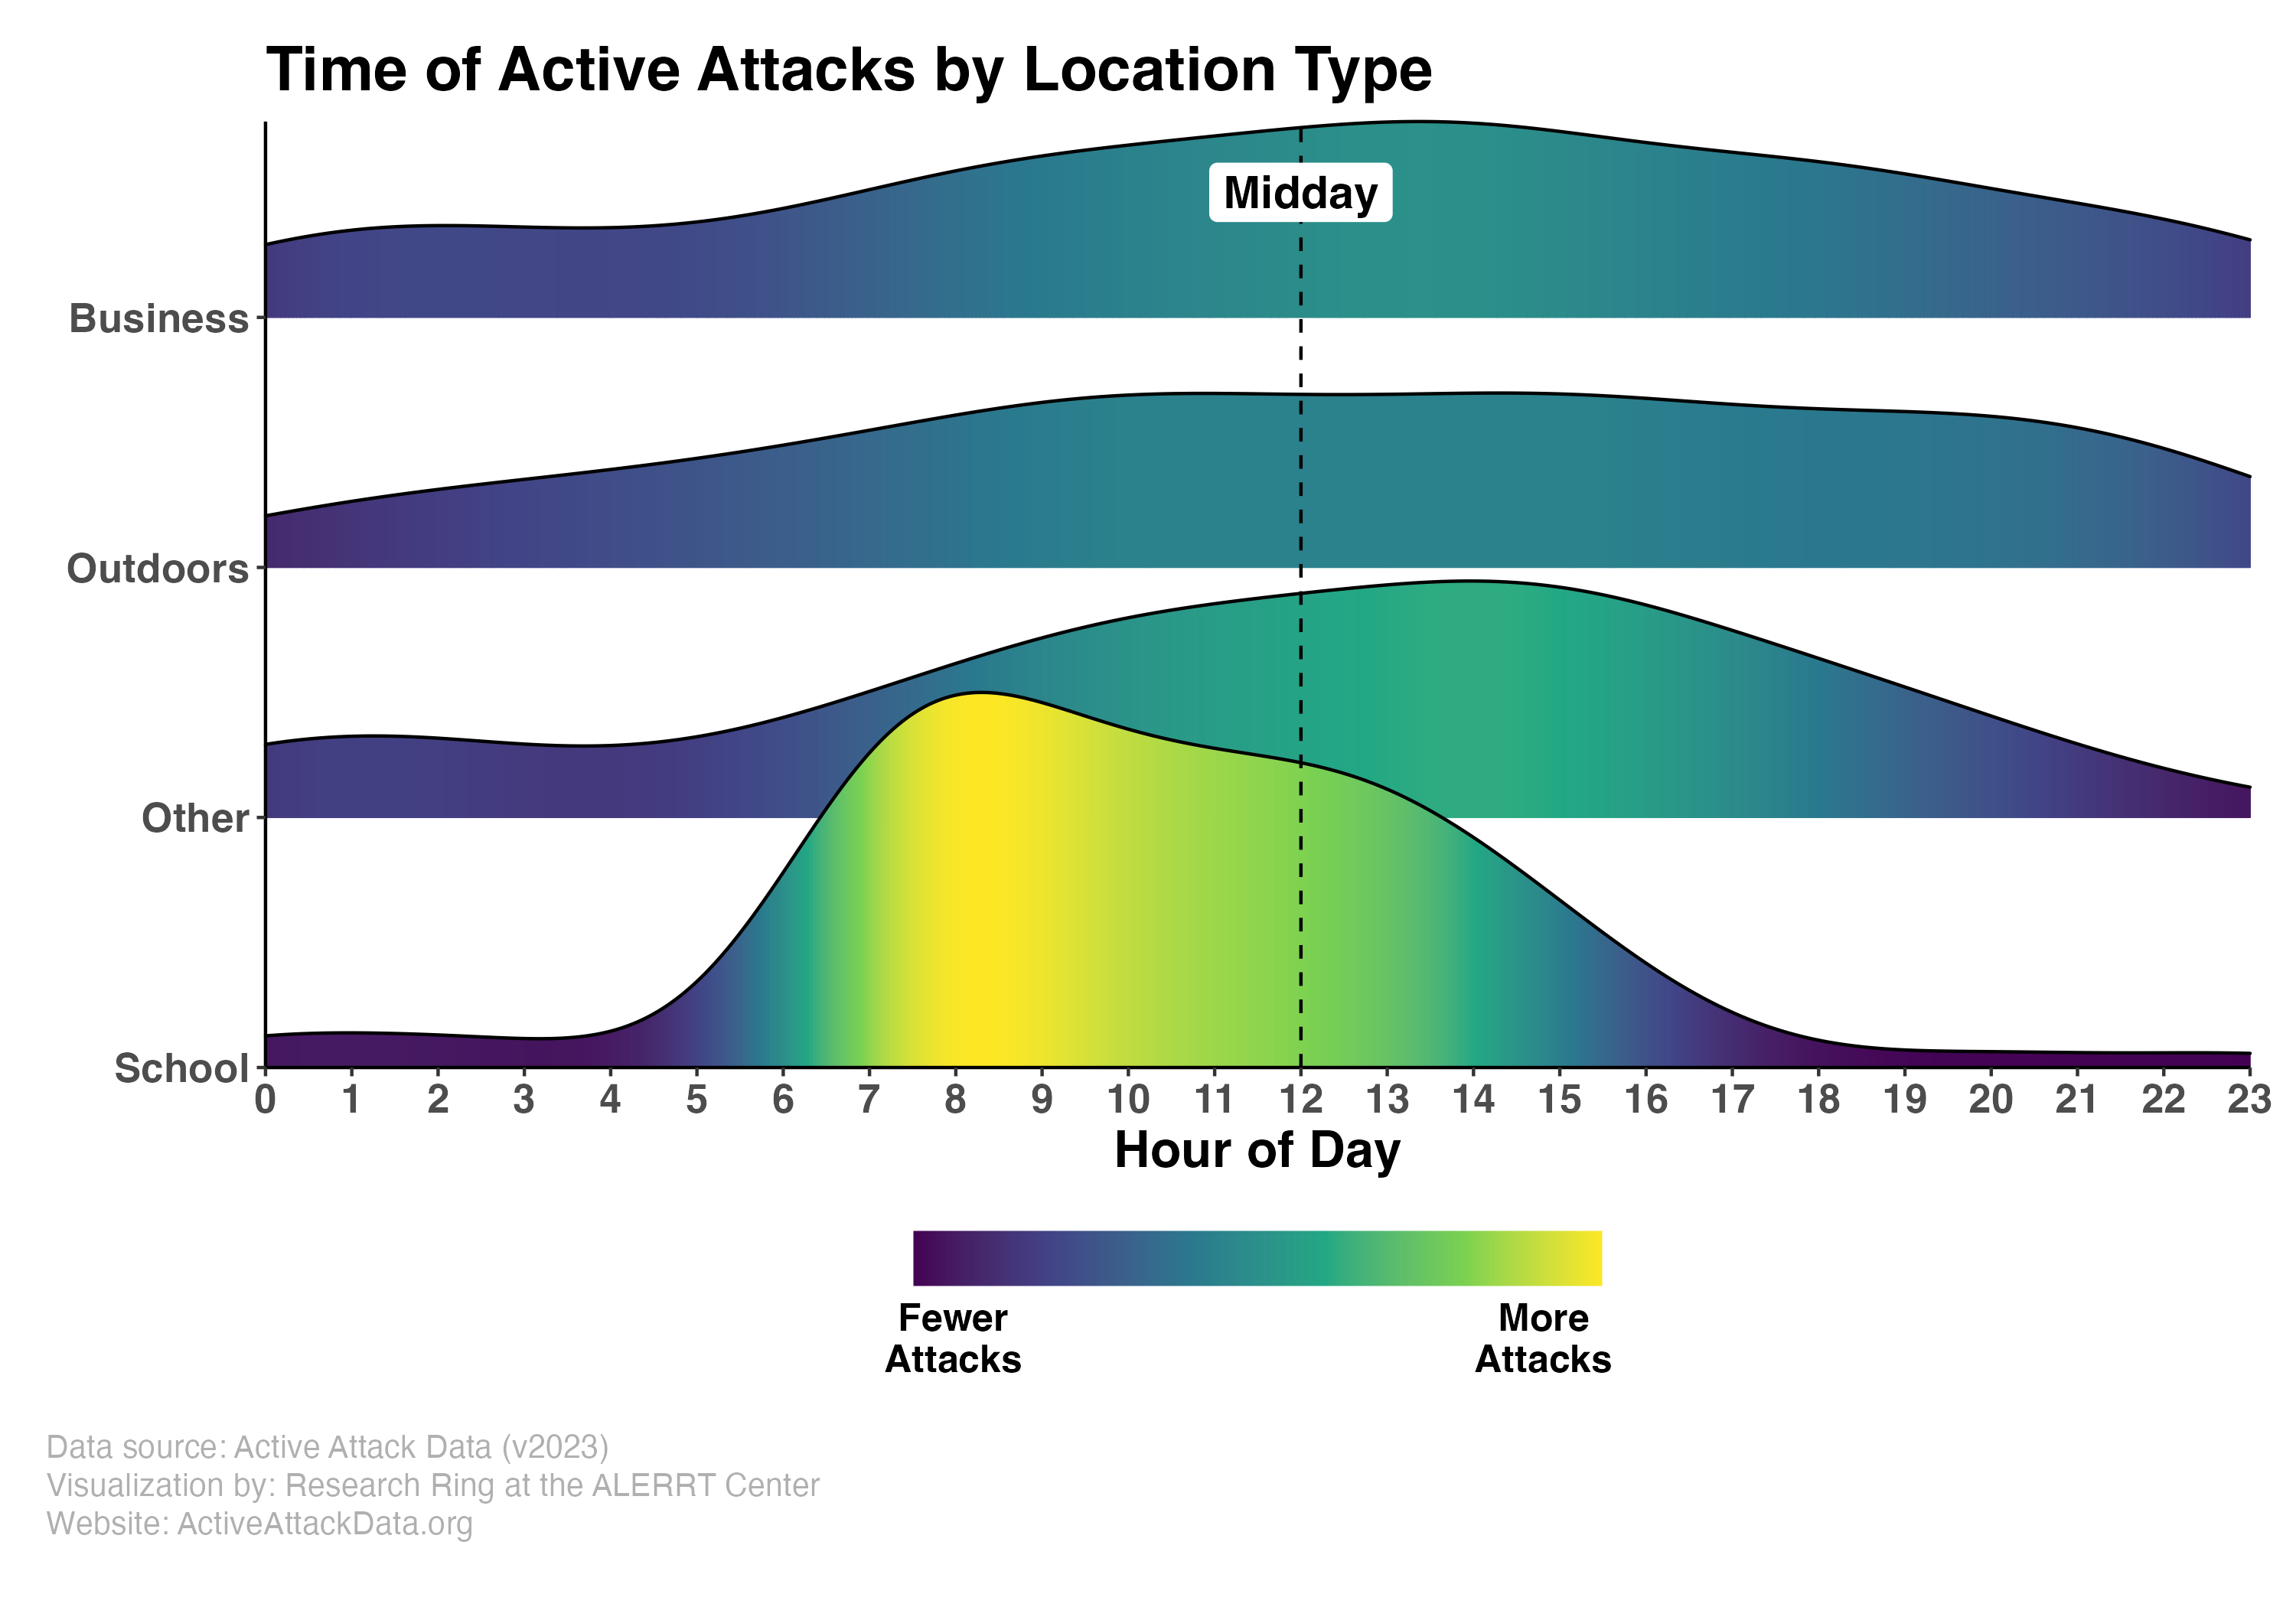
Time of Day by Location Type
When grouped by location type, the tendency of attacks to occur around midday is still observable, though it is modest. The most noticeable trend can be see with attacks at schools, where there is a strong tendency for attacks to occur during the morning hours prior to midday. Note: this plot shows the density of attacks within location types, meaning that the concentration of attacks is relative to other attacks within the same location type and not to concentrations displayed for other location types.
There were 4,055 casualties from active attacks between 2000 and 2024. Of these, 1,415 people died. The visualizations in this section examine the casualties of active attacks.
Attacks vs. Casualties by Year
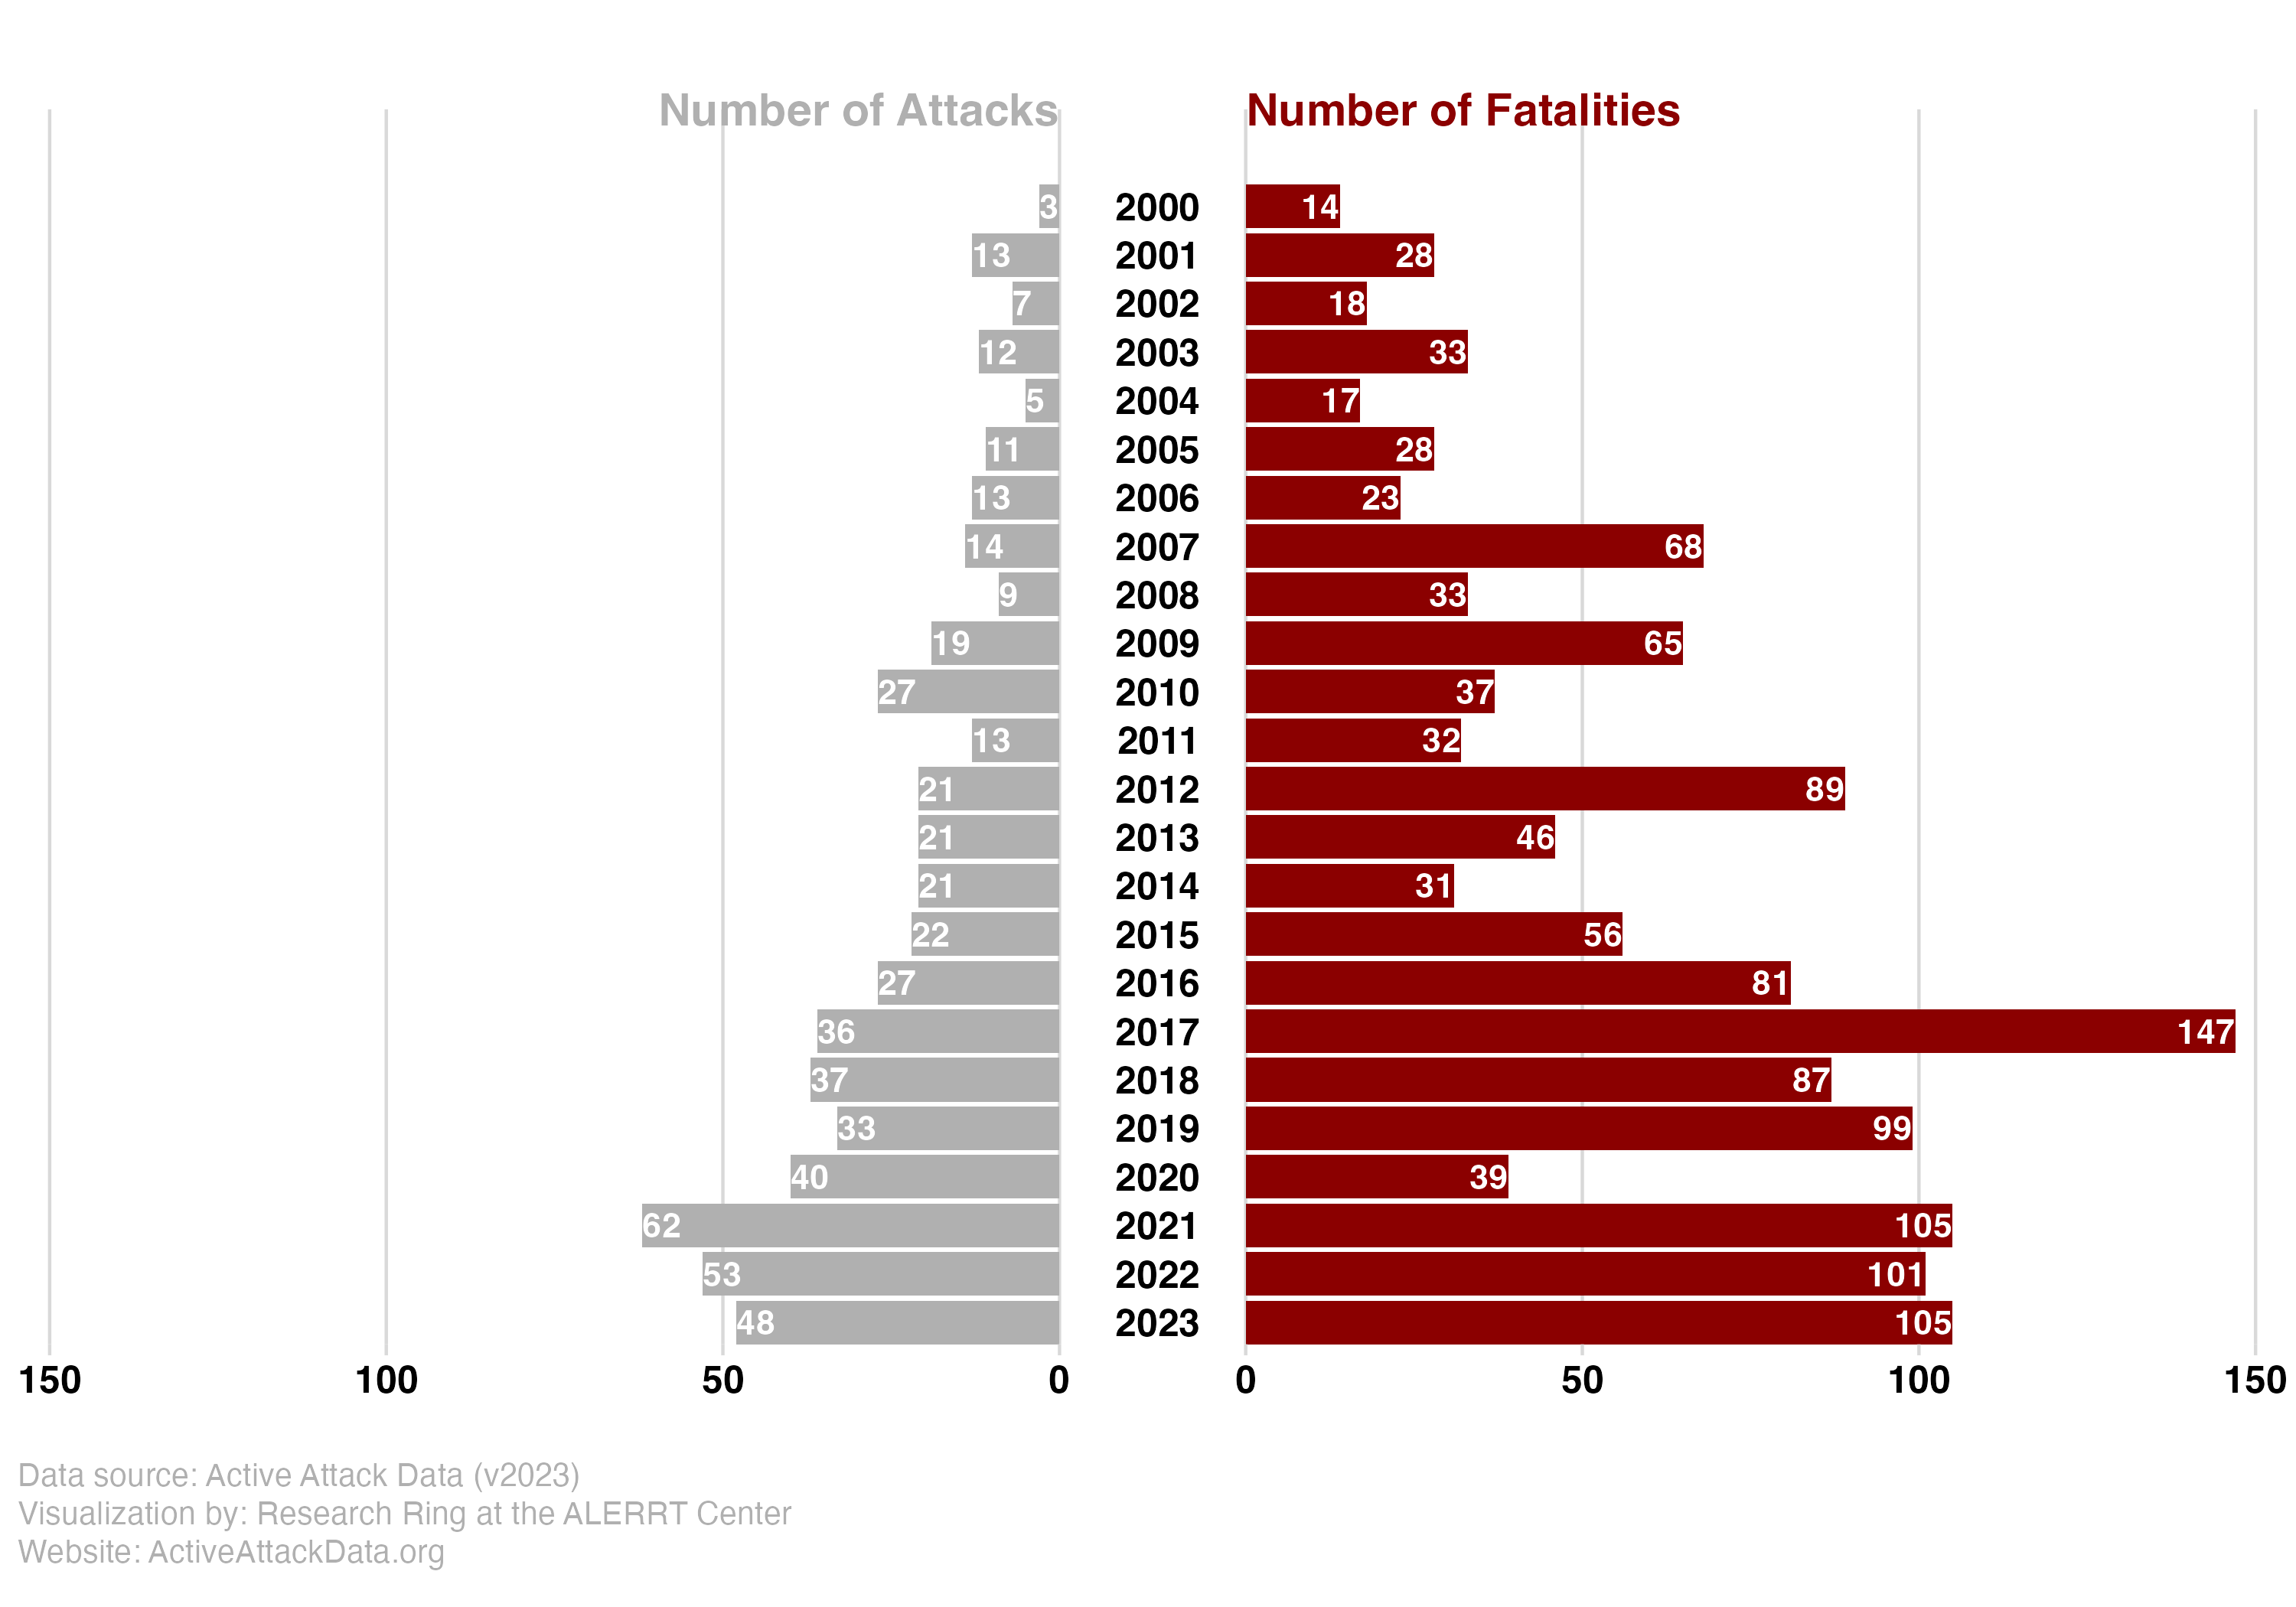
Attacks and total casualties (fatalities and wounded) have been increasing over the course of data collection (2000-2024). For specific years, however, there are noticeable spikes in the number of deaths. These spike often correspond to some of the more well-known attacks. For example:
- 2007: The attack on Apr. 16th at Virginia Tech, Virginia, resulted in 32 deaths, accounting for 47.1% of all attacks that year.
- 2009: The attack on Nov. 5th at Fort Hood (now Fort Cavazos), Texas, resulted in 13 deaths, accounting for 20% of all attacks that year.
- 2012: The school shooting on Dec. 14th at Sandy Hook Elementary School, Connecticut, resulted in 26 deaths, accounting for 29.2% of all attacks that year.
- 2017: The attack on Oct. 1st in Las Vegas, Nevada, resulted in 58 deaths, accounting for 39.5% of all attacks that year.
Of note, while the number of active attacks did not decrease during the COVID-19 pandemic, the lethality of attacks in 2020 decreased to less than half the number of any of the four years previous. In 2021, however, the number of attacks increased and the number of deaths returned to pre-pandemic levels.
Wounded vs. Fatalities per Attack (Interactive)
Most attacks (85.6%) resulted in fewer than 10 casualties (killed and/or wounded) and 32.8% of attacks resulted in no deaths at all. Hover over the points on this plot to get information about that specific attack. Note: hovering over a point on one side of the plot will highlight a corresponding point on the other side.
Wounded vs. Fatalities per Weapon Type (Interactive)
Most attacks (55.4%) were committed using handguns. Among these, total fatalities were generally less than 20 (except for the attacks at Virginia Tech, 2007). Similarly, nearly all handgun attacks resulted in <20 wounded (except the attack at Fort Cavazos, 2009). Attacks using rifles accounted for all of the attacks that surpassed 20 deaths. However, a mix of vehicle and rifle attacks accounted for nearly all attacks with more than 20 wounded. Hover over the points on this plot to get information about that specific attack.
Static plot (.png)
Interactive plot (.html)
Static plot (.png)
Interactive plot (.html)
Active attacks have been recorded in 47 states and the District of Columbia. States with no recorded attacks include Delaware, Montana, and Rhode Island. While most states have at least some number of attacks, the number of attacks (and fatalities) tend to cluster geographically. The visualizations in this section show that geographic dimension.
Attacks & Fatalities by State (Interactive)
The number of active attacks in a state strongly corresponds to the number of fatalities; however, there are some cases where the relative numbers of attacks and fatalities might not align. This map shows how states stack up to one another regarding the raw number of attacks and fatalities. Hover over the map to get information about specific states or over the legend to see which states are grouped together. Tip: click states or legend tiles to freeze selections to make comparisons with other states/groups.
Attacks, Fatalities, & Weapon by Year (Animation)
The number of attacks and fatalities has been increasing annually. This animation documents to specific locations, primary weapon used, and number of fatalities (<4, 4+) per attack for individual years from 2000 to 2024.
Static plot (.png)
Interactive plot (.html)
For common statistics and a quick reference guide, feel free to download our active attack fact sheet.
Here you will be able to find the counts, and/or percents of common variables in active attacks like:
- Weapons
- Attackers
- Locations
- Resolutions
- Victims
There have been 597 active attacks identified.
Primary Weapon:
Firearm: 557 (93.3%)
Blade: 28 (4.7%)
Vehicle: 12 (2%)
Multiple Weapons used in 30.7% of events.
Breakdown of Firearms:
Pistol: 331 (59.4%)
Rifle: 170 (30.5%)
Shotgun: 49 (8.8%)
Unknown: 7 (1.3%)
Number of Attackers:
1 Attacker: 582 (97.5%)
2 Attackers: 12 (2%)
3 Attackers: 3 (0.5%)
African American: 175 (29.3%)
Asian: 22 (3.7%)
Caucasian: 282 (47.2%)
Latino: 78(13.1%)
Middle Eastern: 16 (2.7%)
Other: 4 (0.7%)
Unknown: 20 (3.4%)
Attacker/Victim Relationship:
No Relationship: 388 (65%)
Employee/Former Employee: 94 (15.7%)
Student/Former Student: 67 (11.2%)
All Other: 48 (8%)
Location of Attacks:
Business: 269 (45.1%)
School: 80 (13.4%)
Public/Outdoors: 166 (27.8%)
Church: 20 (3.4%)
Military Base: 6 (1%)
All Other: 56 (9.4%)
Prior to LE Arrival (347 [58.2%])
Shot by Civilian: 27(4.5%)
Subdued by Civilian: 53 (8.9%)
Suicide before Police Arrival: 81 (13.6%)
Flee the Scene: 186 (31.2%)
After LE Arrival (250 [41.8%])
Shot by Police: 132 (22.1%)
Subdued by Police: 54 (9%)
Suicide after Police Arrival: 47 (7.9%)
Surrendered: 17 (2.8%)
Total: 4055 (Median # of Victims: 4)
Wounded: 2640 (Median # of Wounded: 2)
Killed: 1415 (Median # of Victims Killed: 1)
It is the mission of the Research Ring at ALERRT to make the Active Attack Data as freely accessible as possible. Please feel free to explore the raw data in the window to the right or download the data as a .csv file using the download button below. The codebook for the data is also accessible below as a .docx file. The codebook includes variable names, value labels (i.e., for factor/character variables), and summary statistics.
Before downloading the data, please familiarize yourself with the following notes:
The dataset is organized so that each row corresponds to a unique active attack. This means that some variables, like attacker characteristics, need some special handling. Because some events involved multiple attackers, variables like age, race/ethnicity, and sex, are given a special suffix (e.g., _1, _2, _3) that correspond to specific attackers. For an attack with only one shooter, the demographic variables ending in _2 and _3 will contain missing values. Keep in mind, the suffixes were assigned randomly and should not be taken as an indication that individuals described by variables ending in _1 were somehow more central to the attack than the other people involved.
The dataset also includes several variables with the _incl suffix. This suffix refers to an “inclusive definition” applied to the variable coding schemes. ALERRT applies more stringent definitions than does the FBI for coding active attack cases. For instance, injuries that were sustained during an active attack but not directly by the attacker (e.g., sprained ankle from running away) are not counted by ALERRT as injuries in our wound_tot variable. For this reason, there may be differences between our numbers (and visualizations) and the official FBI reports (represented in the variables ending in _incl).
The dataset includes two variables detailing event resolution. These variables are named “resolution” and “resolved_pre_le” and describe how each event was resolved and whether that resolution occurred prior to the arrival of law enforcement, respectively. Although rare, there are a small number of events where the attacker fled the scene after law enforcement arrived. As the vast majority of fleeing attackers leave the scene before law enforcement arrive, these are combined in the resolution data as ending prior to LE arrival.
Data (.csv)
Codebook (.docx)